
Figure 4
- ID
- ZDB-FIG-191220-19
- Publication
- Minhas et al., 2019 - A novel conserved enhancer at zebrafish zic3 and zic6 loci drives neural expression
- Other Figures
- All Figure Page
- Back to All Figure Page
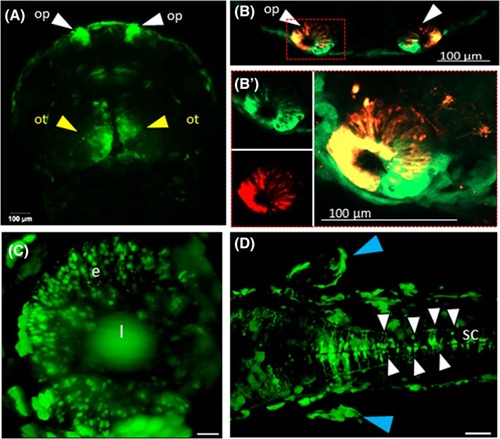
Robust expression pattern driven by CNE12032. Live fluorescent images of CNE12032 stable transgenic zebrafish embryo on day 2. Green‐fluorescent protein‐expressing regions in live embryos are shown, indicated by arrowheads. A, Confocal Z‐stack images of the dorsal view. The white arrowhead indicates GFP‐expressing cells in the olfactory pit. The yellow arrows show the optic tectum. B, Merged channel, highlighting colocalized DiI with EGFP in olfactory sensory neurons. B′, DiI fluorescence in olfactory neurons in the same embryo in a closer view. C, Light‐sheet Z‐stack images in the lateral view, anterior to the left. The white arrow indicates GFP signals in the eye. D, Light‐sheet Z‐stack images in the dorsal view, anterior to the left. The white arrowheads indicate GFP signals in the spinal cord. The blue arrowheads indicate GFP signals in the pectoral fin. Scale bars = 20 μm in (C) and 50 μm in (D). CNE, conserved noncoding element; e, eye; EGFP, enhanced green fluorescent protein; GFP, green fluorescent protein; l, lens; op, olfactory pit; ot, optic tectum; pf, pectoral fin; sc, spinal cord |