FIGURE

Figure 2

ID
ZDB-FIG-191220-17
Publication
Minhas et al., 2019 - A novel conserved enhancer at zebrafish zic3 and zic6 loci drives neural expression
Other Figures
All Figure Page
Back to All Figure Page
Figure 2

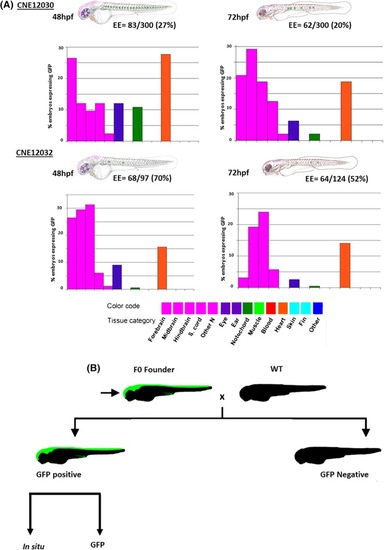
Sites of GFP signals that were recorded in zebrafish embryos that were transiently transfected with a full‐length construct. The reporter genes that were induced by individual CNEs (indicated by the name) are depicted in schematic representations of day 2 (48 hpf) or day 3 (72 hpf) embryos. Categories of a cell type that was positive for a given element are color‐coded, with a GFP‐expressing cell. The bar graphs (y‐axis) show the percentage of GFP‐expressing embryos that presented expression in each tissue category for a given element. The percentage of GFP‐expressing embryos per CNE is indicated beneath each schematic (EE = %). The bar graphs use the same color code as the schematics for each cell type. B, The injected fish were raised to adulthood and crossed with wild‐type fish to screen the germ‐line transmission of enhancers. Each GFP‐positive fish was further studied in situ to compliment the GFP signals and anti‐GFP to confirm GFP expression. CNE, conserved noncoding element; EE, GFP‐expressing embryos; GFP, green fluorescent protein; hpf, hours postfertilization

Expression Data

Expression Detail
Antibody Labeling
Phenotype Data

Phenotype Detail
Acknowledgments
This image is the copyrighted work of the attributed author or publisher, and ZFIN has permission only to display this image to its users. Additional permissions should be obtained from the applicable author or publisher of the image. Full text @ Dev. Dyn.