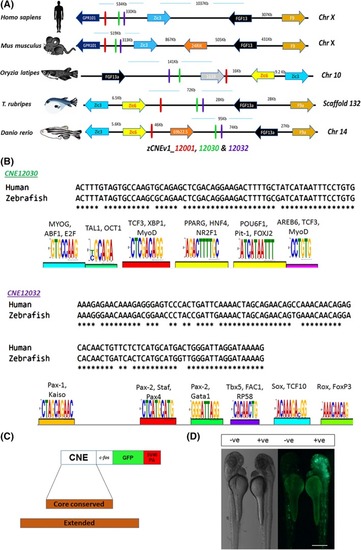
A, Comparative syntenic analysis of human, mouse, medaka, fugu, and zebrafish orthologous loci, depicting the conserved presence of two genes, fgf13a and zic3, in the nearest vicinity of three CNEs (red, green, and purple vertical lines). Genes are color‐coded. The arrow direction depicts the direction of gene transcription. The vertical line depicts the position of the CNE. The horizontal blue line depicts the scale. B, Human and zebrafish alignment of CNE12030 and CNE12032, highlighting the highly similar sequences between them and graphical representation of the transcription factor binding motif that was identified by MEME. Each of the motifs was further screened against the TRANSFAC library to mark binding sites for multiple developmentally important transcription factors. C, Schematic representation of the reporter gene cassette that was used for the in vivo characterization of CNEs. Brown vertical boxes represent different lengths of noncoding DNA that were selected for the transgenic assays. D, Embryos injected with Tol2–c‐fos–EGFP backbone without a CNE (left side embryos, negative) and with a CNE12032‐containing reporter construct (right side embryos, positive) at 48 hpf in the transient transgenic assay. Both pictures are lateral views with the dorsal side toward the right. Scale bar = 500 μm. Chr, chromosome; CNE, conserved noncoding element; EGFP, enhanced green fluorescent protein; MEME, multiple EM for motif elicitation
|
