
- Title
-
From Pioneer to Repressor: Bimodal foxd3 Activity Dynamically Remodels Neural Crest Regulatory Landscape In Vivo
- Authors
- Lukoseviciute, M., Gavriouchkina, D., Williams, R.M., Hochgreb-Hagele, T., Senanayake, U., Chong-Morrison, V., Thongjuea, S., Repapi, E., Mead, A., Sauka-Spengler, T.
- Source
- Full text @ Dev. Cell
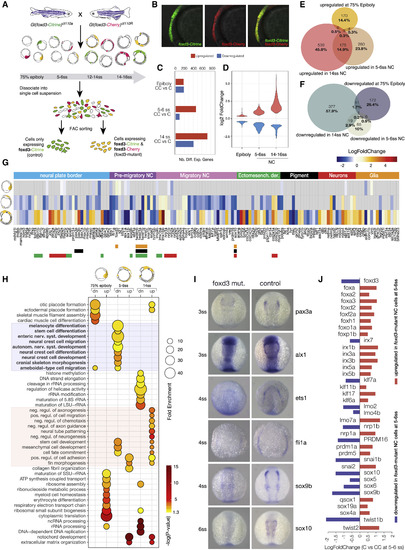
Transcriptional Profiling of foxd3 Mutant NC (A) Experimental strategy for obtaining foxd3-mutant (yellow) and foxd3-control (green) NC cells. Mutant (Citrine/Cherry; CC) and control (Citrine only; C) NC cells were isolated by FACS from crosses of heterozygote fluorescent foxd3 transgenic fish, foxd3-mCherry and foxd3-Citrine at three stages—75% epiboly, 5–6ss, and 14ss. (B) Lateral view of a foxd3-mutant embryo expressing both Citrine and mCherry instead of foxd3 in premigratory NC. (C and D) (C) Bar plot comparing numbers of differentially expressed genes in foxd3-mutant and control NC and (D) violin plots comparing fold-change differences. (E and F) Venn diagrams comparing upregulated (E) and downregulated (F) genes in foxd3-mutant cells. (G) Heatmap showing fold change in expression of known NC genes between foxd3-mutant and control cells at 75% epiboly, 5–6ss, and 14ss. Genes are grouped to reflect NC-GRN structure. (H) Bubble plot summarizing enrichment and ps (Benjamini-Hochberg corrected) for the most significant biological processGO terms associated to differentially expressed genes. (I) In situ hybridization of 3–6ss zebrafish embryos (dorsal view) showing decrease or loss in expression of NC specifier genes in foxd3-mutants. (J) Bar plot representing fold change in expression of NC factors showing that paralogs are differentially regulated by foxd3.
EXPRESSION / LABELING:
PHENOTYPE:
|
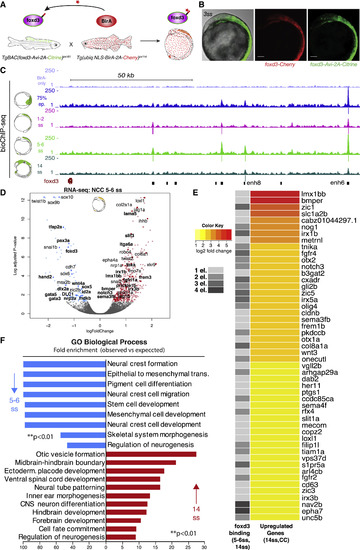
Biotin-ChIP Analysis Supports a Direct Bi-modal foxd3 Regulatory Action on NC Gene Expression (A) Experimental strategy for biotagging foxd3 protein in vivo. Zebrafish transgenics expressing Avi-tagged foxd3 and ubiquitous NLS-BirA are crossed to obtain embryos expressing biotinylated foxd3 for use in biotin ChIP-seq. (B) Lateral view of the embryo issued from crosses of TgBAC(foxd3-Avi-2A-Citrine)ox161 and Gt(foxd3-mCherry)ct110R shows overlap of Citrine and Cherry reporters. Scale bars correspond to 100 μm. (C) Genome browser screenshot showing mapped foxd3-biotin-ChIP-seq at 75% epiboly (in blue), 1–2ss (in pink), 5–6ss (in light green) and 14ss (in dark green) developmental zebrafish stages within the foxd3 regulatory locus. BirA-only ChIP-seq control at 5–6ss is shown in purple (top track). Positions of called peaks are indicated as vertical lines underneath each biotin-foxd3 ChIP track. The bottom track black boxes display identified cis-regulatory elements of the foxd3 gene. (D) Volcano plot highlighting that most NC specifiers are downregulated in foxd3-mutant NC at 5–6ss. On the left side (downregulated genes), genes directly bound by foxd3 at 1–2ss are marked in bold. On the right side (upregulated genes), genes that are still upregulated at 14ss and are directly bound by foxd3 at 5–6ss and 14ss are marked in bold. (E) Heatmap displaying top 50 most upregulated genes, based on log2-fold change of differential gene expression, out of total 223 genes, at 14ss in foxd3 mutant (CC) NC that were found to be occupied by foxd3 at 1, 2, 3, or 4 associated cis-regulatory elements at 5–6ss and 14ss. (F) Bar plot showing GO terms significantly enriched (∗∗p < 0.01) to downregulated genes at 5–6ss in blue and upregulated genes at 14ss in red in foxd3-mutant embryos that were bound by foxd3 at 1–2ss and at 5–6ss/14ss, respectively.
|
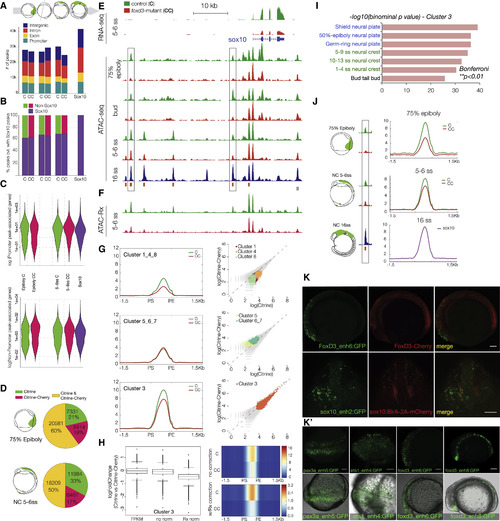
Epigenomic Profiling of Chromatin Accessibility in foxd3 Mutant NC across Developmental Time (A and B) (A) Stacked bar plots depicting genomic annotation of ATAC-seq peaks across stages analyzed (75% epiboly; bud stage; 5–6ss and 14–16ss) and (B) quantification of open elements at earlier stages as a proportion of accessible elements detected in migrating/differentiating NC. (C) Violin plots correlating putative promoter and cis-regulatory elements with gene expression levels. Bimodal distribution of gene expression is associated with putative enhancers at all stages, but with promoters only at epiboly. (D) Pie charts comparing Citrine-only, Cherry-only, and Citrine/Cherry peak number proportions of ATAC-peaks. (E) Genome browser screenshot showing RNA-seq and ATAC-seq profiles in foxd3 mutant (red) and foxd3-control cells (green) within sox10 locus. (F) Tracks showing normalized ATAC-Rx profiles obtained using reference exogenous Drosophila epigenome. (G) Mean density maps of merged profiles and corresponding scatterplots of raw counts for k-means clusters featuring elements with differential accessibility and signal levels in foxd3-mutant and controls at 5–6ss. (H) Boxplots and heatmap (raw read counts) showing fold change in accessibility and comparing ATAC signal levels between control (C) and mutants (CC) k-cluster 3 elements with and without Rx normalization. (I) Bar chart depicting functional annotation of k-cluster 3 shows enrichment in zebrafish gene expression ontology terms linked to NC and neural plate development (Bonferroni; ∗∗p < 0.01). For further analysis of k-cluster, see Figure S4. (J) Merged profiles for 3,565 elements open at 75% epiboly showed more prominent accessibility defect than at 5–6ss (C ≫ CC, > 50%), suggesting biological compensation over time. (K and K′) Cis-regulatory elements from k-cluster 3 show NC-specific reporter activity. (K) Lateral and frontal view of embryos injected with foxd3-enh6 and sox10-enh2 GFP reporter constructs into the genetic background of foxd3-Cherry and sox10:BirA-2A-Cherry, respectively. Scale bars correspond to 100 μm. (K′) Fluorescent and bright-field overlay images of pax3a and ets1(dorsal view) and foxd3 (lateral view) enhancers. Scale bars correspond to 100 μm. |
Reprinted from Developmental Cell, 47, Lukoseviciute, M., Gavriouchkina, D., Williams, R.M., Hochgreb-Hagele, T., Senanayake, U., Chong-Morrison, V., Thongjuea, S., Repapi, E., Mead, A., Sauka-Spengler, T., From Pioneer to Repressor: Bimodal foxd3 Activity Dynamically Remodels Neural Crest Regulatory Landscape In Vivo, 608-628.e6, Copyright (2018) with permission from Elsevier. Full text @ Dev. Cell