
Fig. 2
- ID
- ZDB-FIG-190426-11
- Publication
- Lukoseviciute et al., 2018 - From Pioneer to Repressor: Bimodal foxd3 Activity Dynamically Remodels Neural Crest Regulatory Landscape In Vivo
- Other Figures
- All Figure Page
- Back to All Figure Page
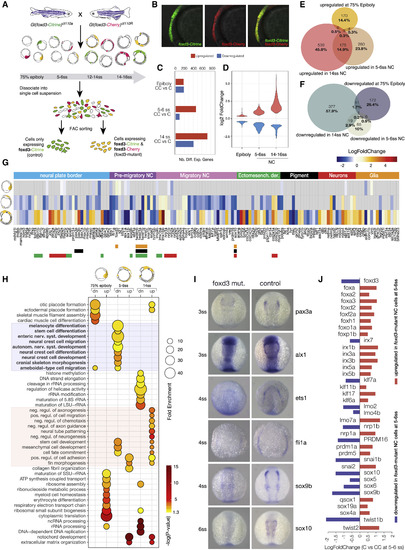
Transcriptional Profiling of foxd3 Mutant NC (A) Experimental strategy for obtaining foxd3-mutant (yellow) and foxd3-control (green) NC cells. Mutant (Citrine/Cherry; CC) and control (Citrine only; C) NC cells were isolated by FACS from crosses of heterozygote fluorescent foxd3 transgenic fish, foxd3-mCherry and foxd3-Citrine at three stages—75% epiboly, 5–6ss, and 14ss. (B) Lateral view of a foxd3-mutant embryo expressing both Citrine and mCherry instead of foxd3 in premigratory NC. (C and D) (C) Bar plot comparing numbers of differentially expressed genes in foxd3-mutant and control NC and (D) violin plots comparing fold-change differences. (E and F) Venn diagrams comparing upregulated (E) and downregulated (F) genes in foxd3-mutant cells. (G) Heatmap showing fold change in expression of known NC genes between foxd3-mutant and control cells at 75% epiboly, 5–6ss, and 14ss. Genes are grouped to reflect NC-GRN structure. (H) Bubble plot summarizing enrichment and ps (Benjamini-Hochberg corrected) for the most significant biological processGO terms associated to differentially expressed genes. (I) In situ hybridization of 3–6ss zebrafish embryos (dorsal view) showing decrease or loss in expression of NC specifier genes in foxd3-mutants. (J) Bar plot representing fold change in expression of NC factors showing that paralogs are differentially regulated by foxd3.
|
| Genes: | |
|---|---|
| Fish: | |
| Anatomical Terms: | |
| Stage Range: | 1-4 somites to 5-9 somites |
| Fish: | |
|---|---|
| Observed In: | |
| Stage Range: | 1-4 somites to 5-9 somites |
Reprinted from Developmental Cell, 47, Lukoseviciute, M., Gavriouchkina, D., Williams, R.M., Hochgreb-Hagele, T., Senanayake, U., Chong-Morrison, V., Thongjuea, S., Repapi, E., Mead, A., Sauka-Spengler, T., From Pioneer to Repressor: Bimodal foxd3 Activity Dynamically Remodels Neural Crest Regulatory Landscape In Vivo, 608-628.e6, Copyright (2018) with permission from Elsevier. Full text @ Dev. Cell