
Fig. 3
- ID
- ZDB-FIG-190426-12
- Publication
- Lukoseviciute et al., 2018 - From Pioneer to Repressor: Bimodal foxd3 Activity Dynamically Remodels Neural Crest Regulatory Landscape In Vivo
- Other Figures
- All Figure Page
- Back to All Figure Page
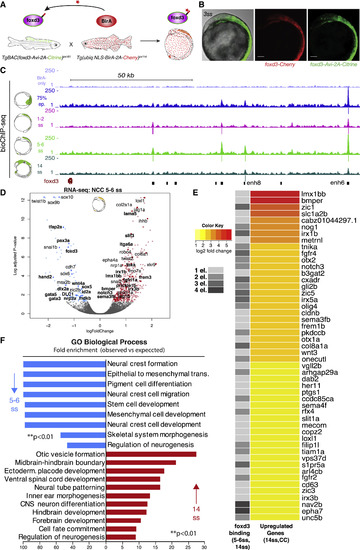
Biotin-ChIP Analysis Supports a Direct Bi-modal foxd3 Regulatory Action on NC Gene Expression (A) Experimental strategy for biotagging foxd3 protein in vivo. Zebrafish transgenics expressing Avi-tagged foxd3 and ubiquitous NLS-BirA are crossed to obtain embryos expressing biotinylated foxd3 for use in biotin ChIP-seq. (B) Lateral view of the embryo issued from crosses of TgBAC(foxd3-Avi-2A-Citrine)ox161 and Gt(foxd3-mCherry)ct110R shows overlap of Citrine and Cherry reporters. Scale bars correspond to 100 μm. (C) Genome browser screenshot showing mapped foxd3-biotin-ChIP-seq at 75% epiboly (in blue), 1–2ss (in pink), 5–6ss (in light green) and 14ss (in dark green) developmental zebrafish stages within the foxd3 regulatory locus. BirA-only ChIP-seq control at 5–6ss is shown in purple (top track). Positions of called peaks are indicated as vertical lines underneath each biotin-foxd3 ChIP track. The bottom track black boxes display identified cis-regulatory elements of the foxd3 gene. (D) Volcano plot highlighting that most NC specifiers are downregulated in foxd3-mutant NC at 5–6ss. On the left side (downregulated genes), genes directly bound by foxd3 at 1–2ss are marked in bold. On the right side (upregulated genes), genes that are still upregulated at 14ss and are directly bound by foxd3 at 5–6ss and 14ss are marked in bold. (E) Heatmap displaying top 50 most upregulated genes, based on log2-fold change of differential gene expression, out of total 223 genes, at 14ss in foxd3 mutant (CC) NC that were found to be occupied by foxd3 at 1, 2, 3, or 4 associated cis-regulatory elements at 5–6ss and 14ss. (F) Bar plot showing GO terms significantly enriched (∗∗p < 0.01) to downregulated genes at 5–6ss in blue and upregulated genes at 14ss in red in foxd3-mutant embryos that were bound by foxd3 at 1–2ss and at 5–6ss/14ss, respectively.
|
Reprinted from Developmental Cell, 47, Lukoseviciute, M., Gavriouchkina, D., Williams, R.M., Hochgreb-Hagele, T., Senanayake, U., Chong-Morrison, V., Thongjuea, S., Repapi, E., Mead, A., Sauka-Spengler, T., From Pioneer to Repressor: Bimodal foxd3 Activity Dynamically Remodels Neural Crest Regulatory Landscape In Vivo, 608-628.e6, Copyright (2018) with permission from Elsevier. Full text @ Dev. Cell