
- Title
-
High glucose levels affect retinal patterning during zebrafish embryogenesis
- Authors
- Singh, A., Castillo, H.A., Brown, J., Kaslin, J., Dwyer, K.M., Gibert, Y.
- Source
- Full text @ Sci. Rep.
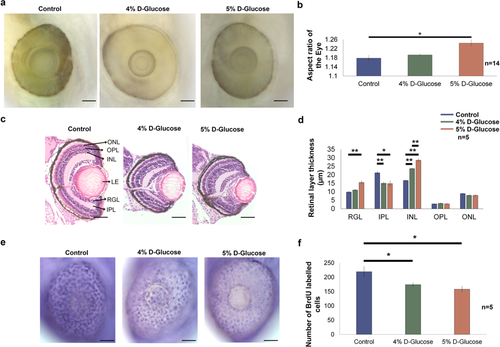
Hyperglycaemia induced changes acquired by the embryonic zebrafish eye. (a) Lateral view of the embryonic zebrafish eye following pulsatile 4 and 5% D-Glucose treatment from 3 hpf until 5 dpf. Control zebrafish were maintained in the vehicle only from 3 hpf until 5 dpf under identical conditions. Scale bar, 50 µm. (b) The aspect ratio of the embryonic zebrafish eye remained unchanged following pulsatile 4% D-Glucose exposure. The aspect ratio of the embryonic zebrafish eye significantly increased following pulsatile 5% D-Glucose treatment from 3 hpf until 5 dpf as compared to controls reflecting an alteration in the morphology of the eye. Error bars indicate mean ± s.e.m.; Statistical differences were computed using two-tailed student’s t-test and are indicated as *p = 0.001, (n = 14). (c) Hematoxylin and Eosin staining depicting representative images of the cross-sections of the embryonic zebrafish eye. WT embryos exposed to 4 and 5% D-Glucose from 3 hpf until 5 dpf in a pulsatile manner exhibited an alteration in the thickness of retinal layers at 5 dpf. Controls remained in identical conditions in the vehicle (E3) only. Scale bar, 50 µm. (d) Statistical analysis demonstrated that WT embryos exposed to 4% D-Glucose from 3 hpf until 5 dpf in a pulsatile manner developed a significant thickness of the INL and a decrease in the thickness of IPL as compared to the control embryos at 5 dpf. WT embryos exposed to 5% D-Glucose from 3 hpf until 5 dpf in a pulsatile manner showed the significantly decreased thickness of IPL, and an increase in the thickness of the RGL and INL, while other retinal layers remained unaffected. Error bars indicate mean ± s.e.m.; Statistical differences were computed using two-tailed student’s t-test and are indicated as *p = 0.001, **p < 0.0005; Results were obtained from representative sections from 5 zebrafish embryos, n = 5. (e) Lateral view of the BrdU labelled embryonic zebrafish eye at 5 dpf following pulsatile 4 and 5% D-Glucose exposure from 3 hpf until 5 dpf. Controls remained in identical conditions in the vehicle (E3) only. Arrows represent BrdU labelled retinal cells. Scale bar, 50 µm. (f) Statistical analysis revealed a significant decrease in BrdU labelled retinal cells following 4 and 5% D-Glucose exposure compared to untreated controls at 5 dpf. Error bars indicate mean ± s.e.m. Statistical differences were computed using two-tailed student’s t-test and are indicated as *p < 0.05. Results were obtained from representative images from 5 zebrafish embryos (n = 5). ONL, outer nuclear layer; OPL, outer plexiform layer; INL, inner nuclear layer; LE, lens; RGL, retinal ganglion layer; IPL, inner plexiform layer.
|
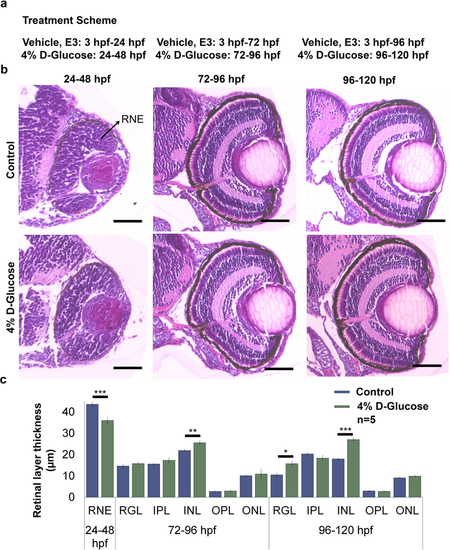
Changes in the retinal layer thickness following 4% D-Glucose exposure at various time points. (a) Treatment scheme. WT embryos were maintained in vehicle until 24, 72 and 96 hpf, followed by a 24 h treatment with 4% D-Glucose until 48, 96 and 120 hpf, respectively. Control embryos were maintained in vehicle until 48, 96 and 120 hpf. (b) Representative images of Hematoxylin and Eosin staining obtained from sections depicting cross-sections of the control and 4% D-Glucose treated embryonic zebrafish eye at 48, 96 and 120 hpf. WT embryos exposed to a 24 h 4% D-Glucose treatment at 24, 72 and 96 hpf exhibited an alteration in the retinal layer thickness at 48, 96 and 120 hpf, respectively. Scale bar, 50 µm (c) Statistical analysis demonstrated that WT embryos exposed to 4% D-Glucose at 24 hpf exhibited a significant decrease in the thickness of the RNE at 48 hpf compared to the controls. WT embryos exposed to 4% D-Glucose at 72 and 96 hpf for 24 h showed a significant increase in the thickness of the INL at 96 hpf, and the INL and RGL at 120 hpf, respectively. Controls remained in similar conditions in the vehicle (E3) only. Error bars indicate mean ± s.e.m.; Statistical differences were computed using two-tailed student’s t-test and are indicated as *p < 0.005, **p = 0.0005, ***p < 0.0005; Results were obtained from representative sections from 5 zebrafish embryos, n = 5. RNE, retinal neural epithelium; ONL, outer nuclear layer; OPL, outer plexiform layer; INL, inner nuclear layer; LE, lens; RGL, retinal ganglion layer; IPL, inner plexiform layer.
|
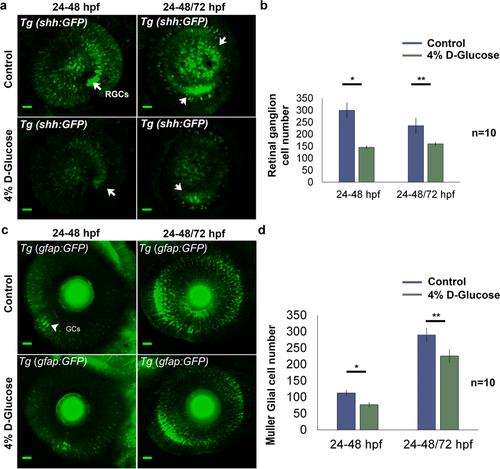
Changes in retinal cell population following 4% D-Glucose exposure. (a) Reduced number of retinal ganglion cells (RGCs) (indicated by white arrows) following 4% D-Glucose exposure. Tg (shh:GFP) embryos were exposed to 4% D-Glucose at 24 hpf, and imaged at 48 hpf. Tg (shh:GFP) embryos were allowed to recover in the vehicle (E3) between 48 and 72 hpf, following 4% D-Glucose exposure between 24–48 hpf, and imaged at 72 hpf. (b) Tg (shh:GFP)exhibited a significant decrease in the number of RGCs at 48 hpf. Following, recovery in the vehicle between 48 and 72 hpf, Tg (shh:GFP) imaged at 72 hpf failed to recover and exhibited significantly reduced RGCs. Error bars indicate mean ± s.e.m.; Statistical differences were computed using two-tailed student’s t-test and are indicated as *p = 0.006, **p < 0.0005; (n = 10). Scale bar, 20 µm. (c) Reduced number of Müeller glial cells (GCs) (indicated by white arrowheads) following 4% D-Glucose exposure. Tg (gfap:GFP) embryos were exposed to 4% D-Glucose at 24 hpf, and imaged at 48 hpf. Tg (gfap:GFP) embryos were allowed to recover in vehicle only between 48 and 72 hpf, following 4% D-Glucose exposure between 24 and 48 hpf, and imaged at 72 hpf. (d) Tg (gfap:GFP) exhibited a significant decrease in the number of GCs at 48 hpf. Following, recovery in the vehicle between 48 and 72 hpf, Tg (gfap:GFP) imaged at 72 hpf failed to recover and exhibited significantly reduced GCs. Error bars indicate mean ± s.e.m.; Statistical differences were computed using two-tailed student’s t-test and are indicated as *p = 0.01, **p < 0.03; (n = 10). Scale bar, 20 µm. RGCs, retinal ganglion cells; GCs, Müeller glial cells.
|
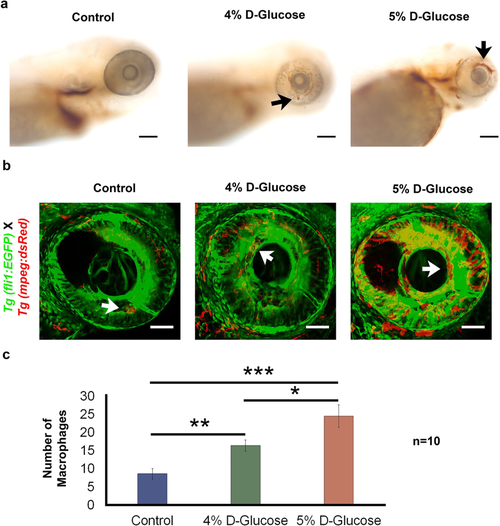
Increased haemoglobin presence and retinal blood vessel leakage following pulsatile high-glucose exposure from 3 hpf until 5 dpf. (a) The increased presence of haemoglobin in the retina (indicated with black arrows) was detected in WT embryos exposed to 4 and 5% D-Glucose in a pulsatile manner from 3 hpf until 5 dpf following O-dianisidine staining indicating increased accumulation of hemoglobin in the retinal blood vessels, which is indicative of leaky retinal blood vessels. Control WT embryos were maintained in the vehicle (E3) only from 3 hpf until 5 dpf under standard conditions. (n = 5). Scale bar, 50 µm. (b) Retinal blood vessel leakage following pulsatile D-Glucose exposure. Tg (fli1:EGFP) X Tg (mpeg:DsRed) embryos were exposed to a fluctuating 4 and 5% D-Glucose treatment from 3 hpf until 5 dpf. Scale bar, 50 µm. (c) Statistical analysis of Tg (fli1:EGFP) X Tg (mpeg:DsRed) exhibited an increase in the number of macrophages (indicated by white arrows) in the retina at 5 dpf, indicating blood vessel leakage. Error bars indicate mean ± s.e.m.; Statistical differences were computed using two-tailed student’s t-test and are indicated as *p = 0.03, **p = 0.007, ***p < 0.001; (n = 10).
|
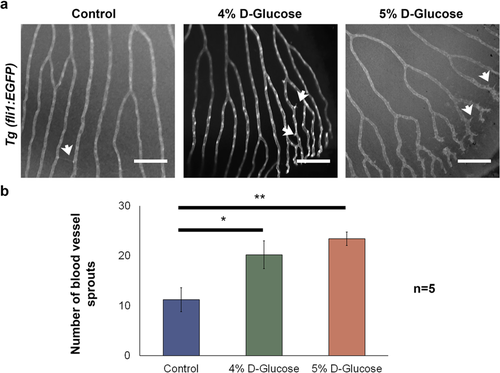
Long-term implications of high-glucose exposure during embryonic stages in the adult zebrafish retina. (a) Retinal vasculature of Tg (fli1:EGFP) zebrafish adults (100 dpf) exposed to vehicle, 4 and 5% D-Glucose from 3 hpf until 5 dpf in a pulsatile manner. 4 and 5% D-Glucose treated group exhibited an increase in the number of hyaloid blood vessel sprouts (indicated by white arrows). (b) Statistical analysis of the number of blood vessel demonstrated a significant increase in the number of hyaloid blood vessel sprouts. Error bars indicate mean ± s.e.m.; Statistical differences were computed using two-tailed student’s t-test and are indicated as *p = 0.02, **p = 0.003; (n = 5). Scale bar, 100 µm. Images inverted to grayscale.
|