
|
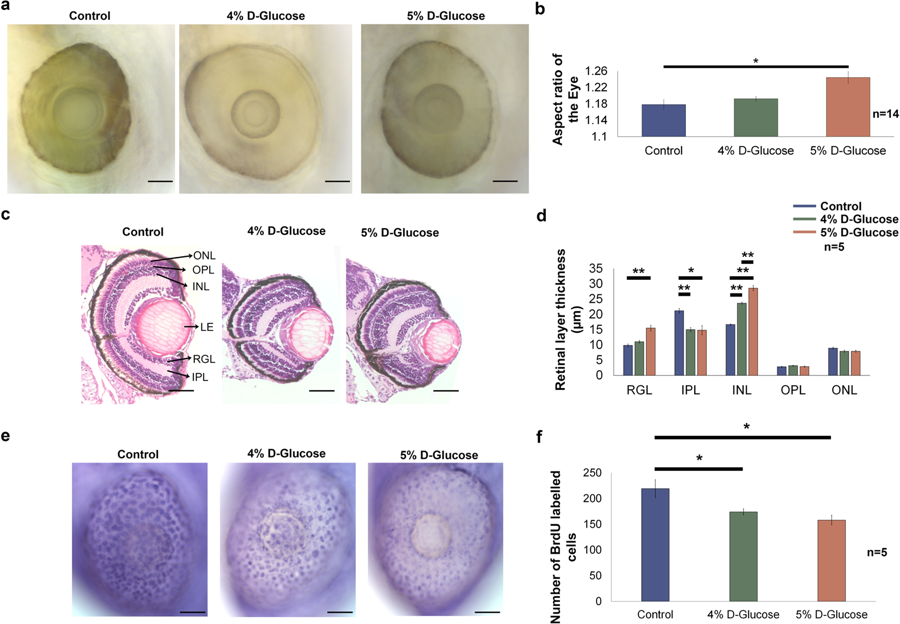
Fig. 2
Hyperglycaemia induced changes acquired by the embryonic zebrafish eye. (a) Lateral view of the embryonic zebrafish eye following pulsatile 4 and 5% D-Glucose treatment from 3 hpf until 5 dpf. Control zebrafish were maintained in the vehicle only from 3 hpf until 5 dpf under identical conditions. Scale bar, 50 µm. (b) The aspect ratio of the embryonic zebrafish eye remained unchanged following pulsatile 4% D-Glucose exposure. The aspect ratio of the embryonic zebrafish eye significantly increased following pulsatile 5% D-Glucose treatment from 3 hpf until 5 dpf as compared to controls reflecting an alteration in the morphology of the eye. Error bars indicate mean ± s.e.m.; Statistical differences were computed using two-tailed student’s t-test and are indicated as *p = 0.001, (n = 14). (c) Hematoxylin and Eosin staining depicting representative images of the cross-sections of the embryonic zebrafish eye. WT embryos exposed to 4 and 5% D-Glucose from 3 hpf until 5 dpf in a pulsatile manner exhibited an alteration in the thickness of retinal layers at 5 dpf. Controls remained in identical conditions in the vehicle (E3) only. Scale bar, 50 µm. (d) Statistical analysis demonstrated that WT embryos exposed to 4% D-Glucose from 3 hpf until 5 dpf in a pulsatile manner developed a significant thickness of the INL and a decrease in the thickness of IPL as compared to the control embryos at 5 dpf. WT embryos exposed to 5% D-Glucose from 3 hpf until 5 dpf in a pulsatile manner showed the significantly decreased thickness of IPL, and an increase in the thickness of the RGL and INL, while other retinal layers remained unaffected. Error bars indicate mean ± s.e.m.; Statistical differences were computed using two-tailed student’s t-test and are indicated as *p = 0.001, **p < 0.0005; Results were obtained from representative sections from 5 zebrafish embryos, n = 5. (e) Lateral view of the BrdU labelled embryonic zebrafish eye at 5 dpf following pulsatile 4 and 5% D-Glucose exposure from 3 hpf until 5 dpf. Controls remained in identical conditions in the vehicle (E3) only. Arrows represent BrdU labelled retinal cells. Scale bar, 50 µm. (f) Statistical analysis revealed a significant decrease in BrdU labelled retinal cells following 4 and 5% D-Glucose exposure compared to untreated controls at 5 dpf. Error bars indicate mean ± s.e.m. Statistical differences were computed using two-tailed student’s t-test and are indicated as *p < 0.05. Results were obtained from representative images from 5 zebrafish embryos (n = 5). ONL, outer nuclear layer; OPL, outer plexiform layer; INL, inner nuclear layer; LE, lens; RGL, retinal ganglion layer; IPL, inner plexiform layer.