
|
Fig. 4
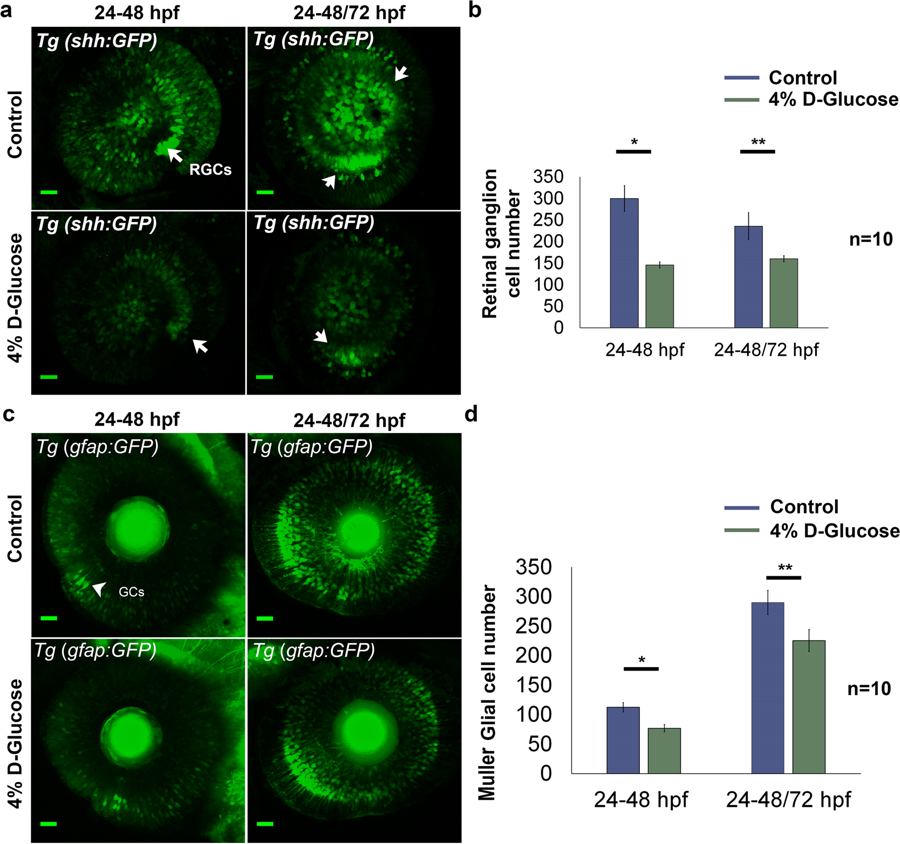
Changes in retinal cell population following 4% D-Glucose exposure. (a) Reduced number of retinal ganglion cells (RGCs) (indicated by white arrows) following 4% D-Glucose exposure. Tg (shh:GFP) embryos were exposed to 4% D-Glucose at 24 hpf, and imaged at 48 hpf. Tg (shh:GFP) embryos were allowed to recover in the vehicle (E3) between 48 and 72 hpf, following 4% D-Glucose exposure between 24–48 hpf, and imaged at 72 hpf. (b) Tg (shh:GFP)exhibited a significant decrease in the number of RGCs at 48 hpf. Following, recovery in the vehicle between 48 and 72 hpf, Tg (shh:GFP) imaged at 72 hpf failed to recover and exhibited significantly reduced RGCs. Error bars indicate mean ± s.e.m.; Statistical differences were computed using two-tailed student’s t-test and are indicated as *p = 0.006, **p < 0.0005; (n = 10). Scale bar, 20 µm. (c) Reduced number of Müeller glial cells (GCs) (indicated by white arrowheads) following 4% D-Glucose exposure. Tg (gfap:GFP) embryos were exposed to 4% D-Glucose at 24 hpf, and imaged at 48 hpf. Tg (gfap:GFP) embryos were allowed to recover in vehicle only between 48 and 72 hpf, following 4% D-Glucose exposure between 24 and 48 hpf, and imaged at 72 hpf. (d) Tg (gfap:GFP) exhibited a significant decrease in the number of GCs at 48 hpf. Following, recovery in the vehicle between 48 and 72 hpf, Tg (gfap:GFP) imaged at 72 hpf failed to recover and exhibited significantly reduced GCs. Error bars indicate mean ± s.e.m.; Statistical differences were computed using two-tailed student’s t-test and are indicated as *p = 0.01, **p < 0.03; (n = 10). Scale bar, 20 µm. RGCs, retinal ganglion cells; GCs, Müeller glial cells.