
|
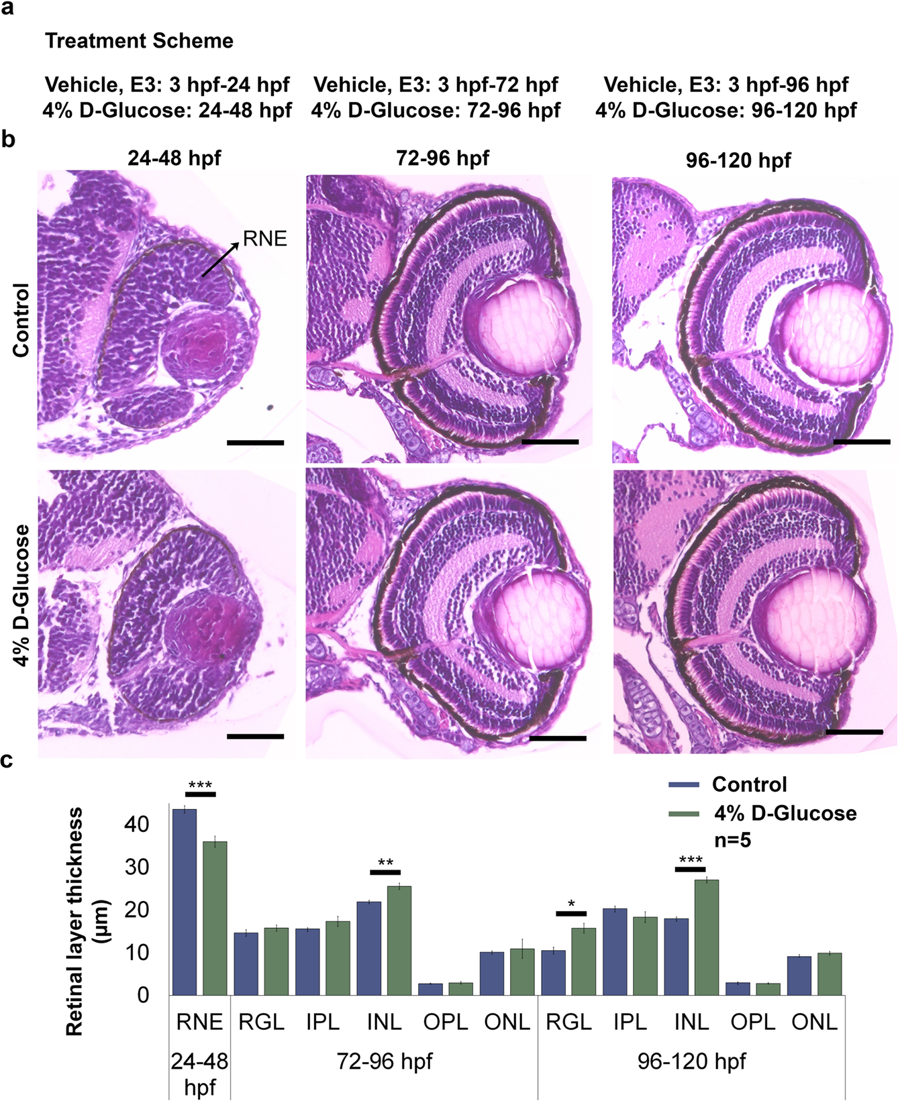
Fig. 3
Changes in the retinal layer thickness following 4% D-Glucose exposure at various time points. (a) Treatment scheme. WT embryos were maintained in vehicle until 24, 72 and 96 hpf, followed by a 24 h treatment with 4% D-Glucose until 48, 96 and 120 hpf, respectively. Control embryos were maintained in vehicle until 48, 96 and 120 hpf. (b) Representative images of Hematoxylin and Eosin staining obtained from sections depicting cross-sections of the control and 4% D-Glucose treated embryonic zebrafish eye at 48, 96 and 120 hpf. WT embryos exposed to a 24 h 4% D-Glucose treatment at 24, 72 and 96 hpf exhibited an alteration in the retinal layer thickness at 48, 96 and 120 hpf, respectively. Scale bar, 50 µm (c) Statistical analysis demonstrated that WT embryos exposed to 4% D-Glucose at 24 hpf exhibited a significant decrease in the thickness of the RNE at 48 hpf compared to the controls. WT embryos exposed to 4% D-Glucose at 72 and 96 hpf for 24 h showed a significant increase in the thickness of the INL at 96 hpf, and the INL and RGL at 120 hpf, respectively. Controls remained in similar conditions in the vehicle (E3) only. Error bars indicate mean ± s.e.m.; Statistical differences were computed using two-tailed student’s t-test and are indicated as *p < 0.005, **p = 0.0005, ***p < 0.0005; Results were obtained from representative sections from 5 zebrafish embryos, n = 5. RNE, retinal neural epithelium; ONL, outer nuclear layer; OPL, outer plexiform layer; INL, inner nuclear layer; LE, lens; RGL, retinal ganglion layer; IPL, inner plexiform layer.