
- Title
-
Planar cell polarity signalling coordinates heart tube remodelling through tissue-scale polarisation of actomyosin activity
- Authors
- Merks, A.M., Swinarski, M., Meyer, A.M., Müller, N.V., Özcan, I., Donat, S., Burger, A., Gilbert, S., Mosimann, C., Abdelilah-Seyfried, S., Panáková, D.
- Source
- Full text @ Nat. Commun.
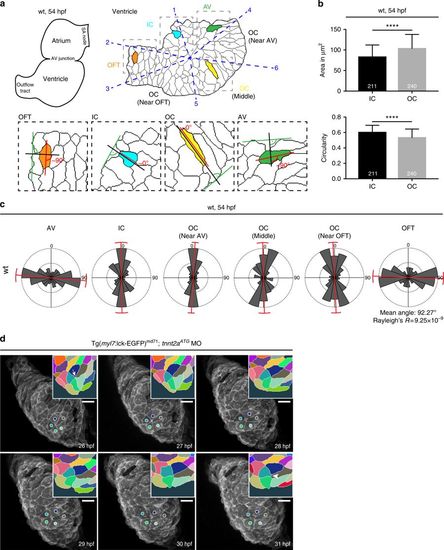
Epithelial remodelling of the LHT during chamber formation. a Scheme of two-chambered zebrafish heart at 54 hpf (left) next to the smoothened outlines of a ventricle depicting shapes of the cardiomyocytes (right). According to six defined anatomical landmarks (number 1–6 in blue) the ventricle is segmented into six regions (blue dashed line) connected with the ventricular centroid, counter-clockwise: between 1–2: inner curvature (IC), 2–3: outflow tract (OFT), 3–5: outer curvature (OC) (near OFT), 5–6: OC (middle), 6–4: OC (near AV) and 4–1: atrio-ventricular junction (AV). In insets, the scheme depicts the cell orientation in four different segments defined as the angle between the cell elongation axis (red) and a 90° angle (black) placed above a tangent (green) on the smoothened outline of a ventricle. Cell orientation of an OC (yellow) and IC (turquoise) cell is ~0°, cell orientation of an OFT (orange) and an AV cell (green) is ~90°. b In wild-type (wt) hearts, OC cardiomyocytes are large and elongated (n = 240, area = 107 μm2, circularity = 0.53), while IC cardiomyocytes are small and rounded (n = 211, area = 83 μm2, circularity = 0.6). Hearts analysed, n = 8. Means ± s.d. ****P < 0.0001, unpaired t-test with Welch correction. c Based on schematic in a, AV (cells analysed, n = 92) and OFT (n = 86) cardiomyocytes assume ~90° angle, IC (n = 57) and OC (n = 295) cells assume ~0° angle. 8 hearts analysed. Variance of angle distribution is labelled in red. d Whole embryo time-lapse imaging of a resolving transition state in a tnnt2a-deficient heart expressing membrane-associated EGFP under myl7 promoter. At 26 hpf, the LHT displays a transition state of five cardiomyocytes sharing a common boundary (arrow in inset). During the following 5 h the transition state resolves with newly forming cell junction (arrowhead in inset). Transition state is colour-coded in the insets, corresponding cells marked with coloured circles. Scale bars, 20 μm |

ZFIN is incorporating published figure images and captions as part of an ongoing project. Figures from some publications have not yet been curated, or are not available for display because of copyright restrictions. PHENOTYPE:
|
|
ZFIN is incorporating published figure images and captions as part of an ongoing project. Figures from some publications have not yet been curated, or are not available for display because of copyright restrictions. PHENOTYPE:
|
|
ZFIN is incorporating published figure images and captions as part of an ongoing project. Figures from some publications have not yet been curated, or are not available for display because of copyright restrictions. |
|
ZFIN is incorporating published figure images and captions as part of an ongoing project. Figures from some publications have not yet been curated, or are not available for display because of copyright restrictions. PHENOTYPE:
|
|
ZFIN is incorporating published figure images and captions as part of an ongoing project. Figures from some publications have not yet been curated, or are not available for display because of copyright restrictions. PHENOTYPE:
|
|
ZFIN is incorporating published figure images and captions as part of an ongoing project. Figures from some publications have not yet been curated, or are not available for display because of copyright restrictions. PHENOTYPE:
|
|
ZFIN is incorporating published figure images and captions as part of an ongoing project. Figures from some publications have not yet been curated, or are not available for display because of copyright restrictions. PHENOTYPE:
|
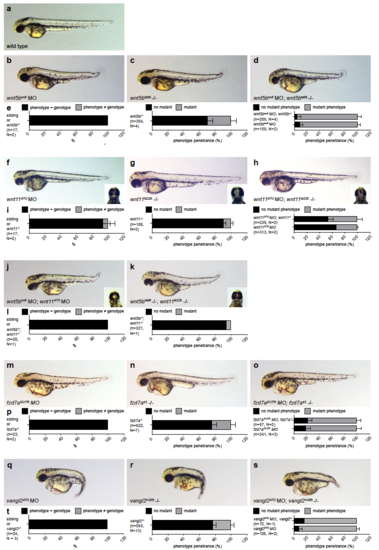
MO-induced phenotypes recapitulate PCP-mutants at 54 hpf (a, b–d, f–h, j, k, m–o, q–s) Embryos at 54 hpf. Phenotypic and genotypic characterization of wnt5bex6 morphants (b) and wnt5bta98 mutants (c), wnt11ATG morphants (f) and wnt11tx226 mutants (g), wnt5bex6; wnt11ATG double morphants (j) and wnt5bta98; wnt11tx226 double mutants (k), fzd7a5’UTR morphants (m) and fzd7ae3 mutants (n) and vangl2ATG morphants (q) and vangl2m209 mutants (r) compared to wild type embryos (a). Blinding experiments reveal 100% consistency of the phenotype (chosen and encrypted by person 1) with the genotype (carried out by person 2) for wnt5bta98 mutants (e, left), wnt5bta98; wnt11tx226 double mutants (l, left), fzd7ae3 mutants (p, left) and vangl2m209 mutants (t, left); and 94% consistency for wnt11tx226 mutants (i, left) from a blinded mix of siblings and mutants. The penetrance of the respective mutant phenotypes is recorded with 30% for wnt5bta98 mutants (e, middle), 10% for wnt11tx226 mutants (i, middle), 5% for wnt5bta98; wnt11tx226 double mutants (l, middle), 24% for fzd7ae3 mutants (p, middle) and 23% for vangl2m209 mutants (t, middle). To prove usage of the optimal dose of MO that does not lead to off-target effects the phenotype of individual MO-knockdowns was compared to MO-injections in the mutants: wnt5bex6 morphants (91% phenotype) with wnt5bex6 MO in wnt5bta98 mutants (d, 95% phenotype); wnt11ATG morphants (33% phenotype) with wnt11ATG MO in wnt11tx226 mutants (h; 46% phenotype); fzd7a5’UTR morphants (81% phenotype) with fzd7a5’UTR MO in fzd7ae3 mutants (o; 77% phenotype) and vangl2ATG morphants (91% phenotype) with vangl2ATG MO in vangl2m209 mutants (s; 83% phenotype). Means±s.d.. Ordinary two-way ANOVA. Reported P values are multiplicity adjusted for each comparison. Uncapitalized n represents number of embryos. |