
- Title
-
Pkd2l1 is required for mechanoception in cerebrospinal fluid-contacting neurons and maintenance of spine curvature
- Authors
- Sternberg, J.R., Prendergast, A.E., Brosse, L., Cantaut-Belarif, Y., Thouvenin, O., Orts-Del'Immagine, A., Castillo, L., Djenoune, L., Kurisu, S., McDearmid, J.R., Bardet, P.L., Boccara, C., Okamoto, H., Delmas, P., Wyart, C.
- Source
- Full text @ Nat. Commun.
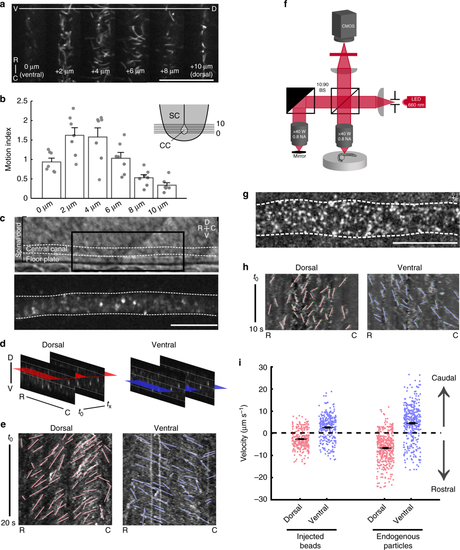
Bidirectional flow of cerebrospinal fluid in the central canal of the spinal cord. a Single frames from time lapses of 24 h post fertilization (hpf) Tg(β-actin:Arl13B-GFP) embryos expressing GFP in cilia. Images taken from progressively dorsal focal planes. Scale: 25 µm. b Quantification of ciliary motion from time lapses; ventral planes exhibit more ciliary motion than dorsal planes (one-way ANOVA F = 12.2, p = 5.92 × 10‒7, see Methods for motion index quantification) SC spinal cord, CC central canal. c Lateral view of the central canal in transmitted light (top) and filled with fluorescent beads (bottom). Scale: 20 µm. d Schematic of horizontal slices taken for kymograph analysis for velocities of beads or endogenous particles. e Representative kymographs of beads in the central canal. Analyzed trajectories are in red (dorsal) or blue (ventral). f Imaging setup for full-field optical coherence tomography (FF-OCT). g Lateral view of the central canal showing endogenous particles obtained from FF-OCT. Scale: 20 µm. h Representative kymographs of endogenous particles in the central canal. Analyzed trajectories are in red (dorsal) or blue (ventral). i Velocities of exogenous particles (beads) and endogenous particles. Beads: 307 trajectories from n = 7 embryos; endogenous particles: 452 trajectories from n = 7 embryos. Error bars represent s.e.m. D dorsal, V ventral, R rostral, C caudal |
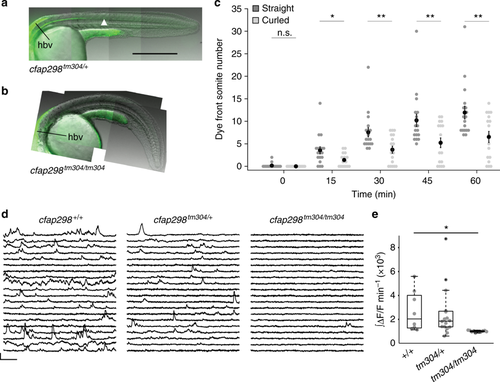
cfap298 is required for CSF transport down the rostrocaudal axis and activity of sensory CSF-contacting neurons. Representative images of 28 hpf a cfap298+/+ and b cfap298tm304/tm304 embryos 60 min after injection of fluorescent beads into the hindbrain ventricle (labeled by the black line), the bead front is indicated by an arrowhead in a. Scale: 250 µm. c Quantification of dye front experiments. (n = 18 straight cfap298+/+ and cfap298tm304/+ embryos, n = 17 curled cfap298tm304/tm304 embryos). Each point represents one embryo. Error bars represent s.e.m, *p < 0.05, **p < 0.01. d Sample traces of calcium activity in CSF-cNs labeled in Tg(pkd2l1:GCaMP5G) at 25 hpf in cfap298+/+, cfap298tm304/+, and cfap298tm304/tm304. Traces represent cells with the median integral values taken from all embryos. Scale: 30 s, 30% ΔF/F. e Normalized and integrated calcium activity per embryo. Each point represents the average activity across all CSF-contacting neurons for one embryo. cfap298m304/tm304 embryos (n = 11 embryos, 165 cells) had significantly reduced activity compared to wild type (n = 8 embryos, 73 cells; one-way ANOVA, t = 3.7, p = 1.7 × 10‒3, α = 0.0167 following Bonferroni correction for multiple testing). The central mark on the box plot indicates the median, the bottom and top edges of the box indicate the 25th and 75th percentiles. The whiskers extend to the most extreme data points not considered outliers, and the outlier is identified with a “+” symbol |
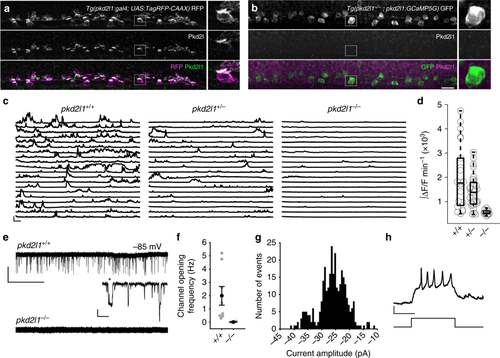
Spontaneous activity in CSF-contacting neurons requires Pkd2l1. Immunohistochemistry for zebrafish Pkd2l1 in 30 hpf a Tg(pkd2l1:gal4; UAS:TagRFP-CAAX) or b Tg(pkd2l1−/−; pkd2l1:GCaMP5G) embryos. Right: magnification of the area in the gray box. No Pkd2l1 was detected in pkd2l1−/− embryos. Scale: 20 µm. c Calcium imaging traces from ventral CSF-cNs in 24–26 hpf Tg(pkd21l:GCaMP5G) embryos. Traces represent cells with the median integral values taken from all embryos. Scale: 30 s, 100% ΔF/F. d Integral quantification of CSF-cN calcium activity. Each point reflects the average calcium activity for all cells from one embryo (n = 22 pkd2l1+/+, n = 32 pkd2l1+/−, n = 12 pkd2l1−/− embryos, p = 1.94 × 10‒13, comparison between pkd2l1+/+ and pkd2l1−/−, linear mixed models). The central mark on the box plot indicates the median, the bottom and top edges of the box indicate the 25th and 75th percentiles. The whiskers extend to the most extreme data points not considered outliers. e Gap-free voltage-clamp (VC) recordings from ventral CSF-cNs show extensive single channel opening exclusively in pkd2l1+/+ embryos. Scale: top: 10 s, 20 pA; bottom: 20 ms, 10 pA. f Channel opening frequency in ventral CSF-cNs of pkd2l1+/+ and pkd2l1−/− embryos (n = 8 pkd2l1+/+ CSF-cNs from eight embryos, n = 3 pkd2l1−/− CSF-cNs from two embryos). Error bars represent s.e.m. g Distribution of channel amplitudes at −85 mV in gap-free voltage-clamp recordings of pkd2l1+/+ CSF-cNs (mean amplitude 26.0 ± 5.1 pA). h Representative firing of a ventral CSF-cN at 28 hpf. Six out of seven ventral CSF-cNs fired single or repetitive action potentials in response to 10–20 pA of injected current. Scale: 100 ms, 20 mV |
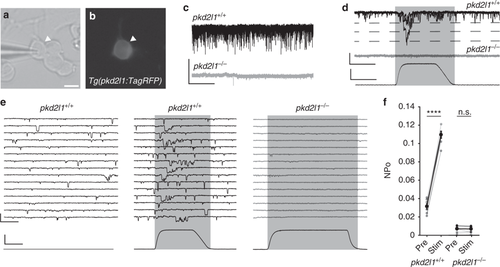
CSF-contacting neurons require Pkd2l1 to respond to mechanical pressure. a Transmitted light and b fluorescent images of a cultured CSF-cN from a Tg(pkd2l1:TagRFP) embryo. Scale: 5 µm. c Gap-free VC recordings from CSF-cNs in vitro show extensive single channel opening in pkd2l1+/+ but not pkd2l1−/− embryos, comparable to results in vivo. Scale: 2 s, 20 pA. d Gap-free VC recording from a cultured CSF-cN while a mechanical stimulus is applied, showing an increase in channel opening during the stimulus in pkd2l1+/+. Scale: top: 20 ms, 25 pA, bottom: 20 ms, 2 µm. e Gap-free recording from cultured CSF-cNs while a mechanical stimulus is applied. Scale: top: 20 ms, 25 pA, bottom: 20 ms, 2 µm. f Quantification of channel opening probability in response to mechanical stimulation of pkd2l1+/+ and pkd2l1−/− CSF-cNs (n = 7 pkd2l1+/+ CSF-cNs, pre vs. stim p = 1.6 × 10⁻⁶; n = 10 pkd2l1−/− CSF-cNs, pre vs. stim p = 0.76, paired t test). Error bars represent s.e.m. |
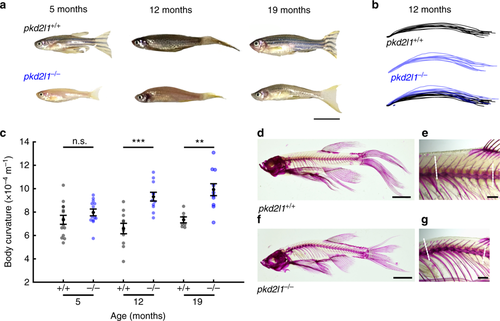
Pkd2l1 is necessary to maintain a straight spine. a Representative pkd2l1+/+ and sibling pkd21−/− adult zebrafish at adult stages. Scale: 1 cm. b Body curvature traces from pkd2l1+/+ (black) and pkd2l1−/− (blue) adults at 12 months (n = 11 pkd21+/+, n = 11 pkd2l1−/−). c Quantification of body axis curvature. Each point represents one fish. Error bars represent s.e.m. (5 months: n = 14 pkd2l1+/+, n = 13 pkd2l1−/−, p = 0.02; 12 months: n = 11 pkd2l1+/+, n = 11 pkd2l1−/−, p = 1.42 × 10‒4; 19 months: n = 7 pkd2l1+/+, n = 11 pkd2l1−/−, p = 1.5 × 10‒3; two-sample t test). d Alizarin red staining of bones of an adult pkd2l1+/+ fish at 20 months of age, showing little to no spinal kyphosis. Scale: 5 mm. e High-magnification image of the precaudal region of the pkd2l1+/+ spine. Dotted lines indicate vectors used to calculate the Cobb angle. Scale: 1 mm. f Alizarin red staining of an adult pkd2l1−/− fish. Note the kyphosis in the precaudal region. Scale: 5 mm. g High-magnification image reveals pronounced kyphosis, no torsion is evident (see Supplementary Table 2 for Cobb angles). Scale: 1 mm PHENOTYPE:
|
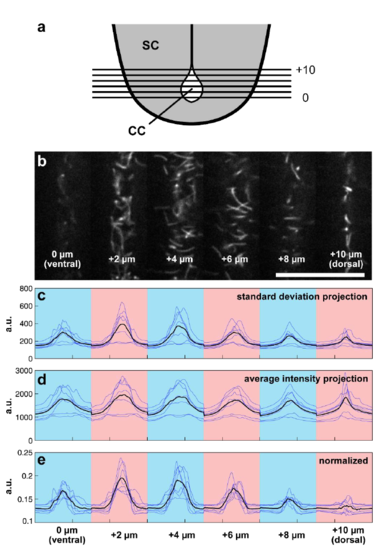
Estimation of wild type ciliary motion as a function of position in the dorsoventral axis. (a) Schematic illustrating ciliary imaging experiments. Time-lapses are taken from optical slices covering the central canal moving ventral to dorsal 2 μm apart. (b) Representative frame from a conjoined time-lapse showing 6 planes of central canal cilia. Scale: 25 μm. (c) Intensity plot profiles derived from standard deviation projections. Blue traces are individual embryos, black trace represents average across all embryos. Blue and pink coloration defines the optical section. (d) Intensity plot profiles derived from average intensity projections. (e) Normalized profiles generated by dividing individual standard deviation profile plots by average intensity profile plots reveal a greater motility 2 - 4 μm away from the ventral boarder of the central canal. a.u. = arbitrary units. |
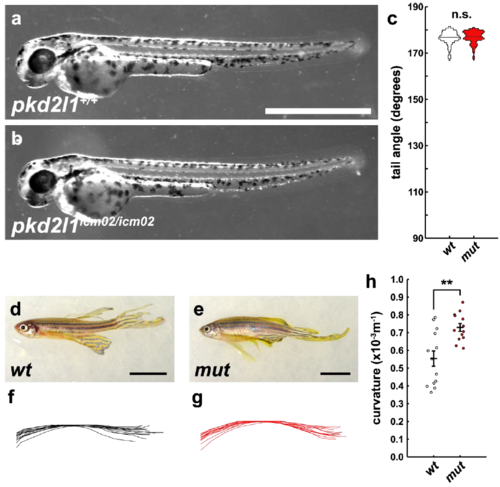
After three generations, pkd2l1icm02/icm02 fish continue to develop kyphosis as adults. (a) 48 hpf wild-type larva exhibiting normal development and a near 180° tail angle. Scale bar: 1 mm. (b) No difference is observed in the 48 hpf pkd2l1icm02/icm02 larvae. (c) Violin plot of tail angles comparing a wild-type clutch to a mutant clutch at 48 hpf; there is no significant difference in tail angle. (d) Wild-type adult fish at 12 months. Scale bar: 1 cm. (e) pkd2l1icm02/icm02 adult fish at same age. Scale bar: 1 cm. (f) Traces of spinal curvature derived from widefield images taken of wild-type adults. (g) Same traces from pkd2l1icm02/icm02 mutant adults. (h) Quantitative comparison of spinal curvature between wild-type and mutant adults at 12 months. Mutant spinal curvature is significantly greater (p = 0.0013, two-sample t-test). Error bars represent s.e.m. |

The cfap298 mutation does not abolish sensory responses to muscle contraction in 1 dpf zebrafish. (a) Top: Images of Tg(pkd2l1:GCaMP5G) in cfap298+/+, cfap298tm304/+, cfap298tm304/tm304. Scale: 50 μm. Bottom: Sample calcium imaging traces of CSF-cNs at 1 dpf during active muscle contractions. Gray bars indicate periods of contraction when the cell moves out of the imaging plane. Scale: 10 s, 100% ΔF/F. (b) Responses to muscle contractions in individual cells for each genotype (cfap298+/+ n = 7 fish, 140 cells; cfap298tm304/+ n = 12 fish, 275 cells; cfap298tm304/tm304 n = 20 fish, 430 cells). (c) Cumulative distribution plot of the responses for all genotypes shows a reduced response of CSF-cNs to spontaneous contraction in cfap298tm304/tm304 embryos (linear mixed models, p = 5 x 10⁻⁴). |
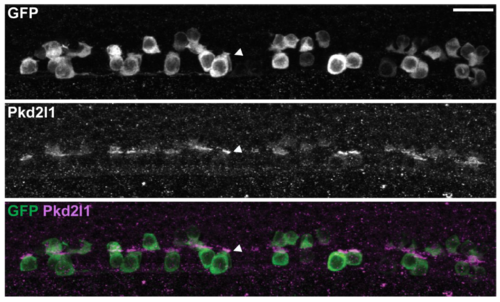
Pkd2l1 is correctly localized to the apical extension in the cfap298m304/tm304 mutant. Pkd2l1 immunohistochemistry in Tg(pkd2l1:GCaMP5G; cfap298tm304/tm304) at 30 hpf. Top: GFP staining, middle: Pkd2l1 staining, bottom: merge. Arrowhead shows dense Pkd2l1 localization in the apical extension contacting the CSF in the central canal. Scale: 20 μm. |