
|
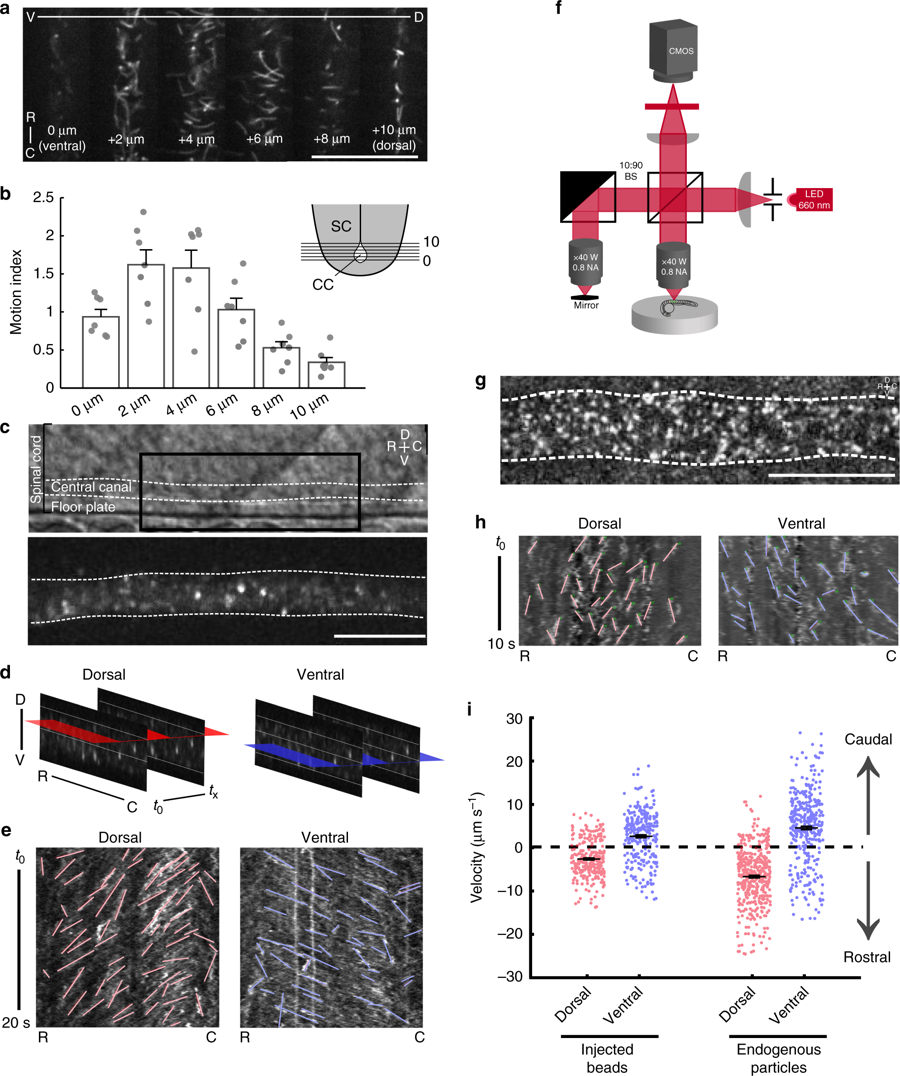
Fig. 1
Bidirectional flow of cerebrospinal fluid in the central canal of the spinal cord. a Single frames from time lapses of 24 h post fertilization (hpf) Tg(β-actin:Arl13B-GFP) embryos expressing GFP in cilia. Images taken from progressively dorsal focal planes. Scale: 25 µm. b Quantification of ciliary motion from time lapses; ventral planes exhibit more ciliary motion than dorsal planes (one-way ANOVA F = 12.2, p = 5.92 × 10‒7, see Methods for motion index quantification) SC spinal cord, CC central canal. c Lateral view of the central canal in transmitted light (top) and filled with fluorescent beads (bottom). Scale: 20 µm. d Schematic of horizontal slices taken for kymograph analysis for velocities of beads or endogenous particles. e Representative kymographs of beads in the central canal. Analyzed trajectories are in red (dorsal) or blue (ventral). f Imaging setup for full-field optical coherence tomography (FF-OCT). g Lateral view of the central canal showing endogenous particles obtained from FF-OCT. Scale: 20 µm. h Representative kymographs of endogenous particles in the central canal. Analyzed trajectories are in red (dorsal) or blue (ventral). i Velocities of exogenous particles (beads) and endogenous particles. Beads: 307 trajectories from n = 7 embryos; endogenous particles: 452 trajectories from n = 7 embryos. Error bars represent s.e.m. D dorsal, V ventral, R rostral, C caudal