
- Title
-
A metabolic interplay coordinated by HLX regulates myeloid differentiation and AML through partly overlapping pathways
- Authors
- Piragyte, I., Clapes, T., Polyzou, A., Klein Geltink, R.I., Lefkopoulos, S., Yin, N., Cauchy, P., Curtis, J.D., Klaeylé, L., Langa, X., Beckmann, C.C.A., Wlodarski, M.W., Müller, P., Van Essen, D., Rambold, A., Kapp, F.G., Mione, M., Buescher, J.M., Pearce, E.L., Polyzos, A., Trompouki, E.
- Source
- Full text @ Nat. Commun.
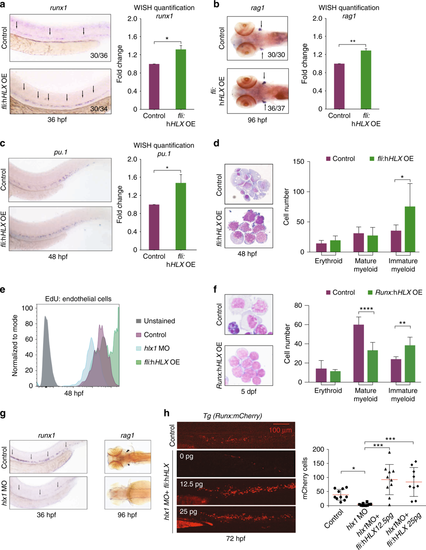
hlx1 regulates hematopoietic stem cell formation and myeloid cell maturation in zebrafish. a–b Whole-mount in situ hybridization (WISH) for runx1 (a) and rag1 (b) in control or fli:hHLXOE zebrafish embryos at 36 or 96 hpf, respectively. Arrows indicate HSPCs. Numbers in the bottom right corner of panels indicate the number of zebrafish embryos with the indicated phenotype compared to the total number of zebrafish analyzed. Quantification of WISH was performed using FIJI software and statistical significance of three independent experiments in 12 zebrafish embryos was evaluated by Student’s t-test, *P < 0.05, **P < 0.01 (mean + s.d.). c WISH for the early myeloid marker pu.1 in control or fli:hHLXOE zebrafish embryos at 48 hpf. Numbers and WISH quantification was performed as described above (n = 3, in total 12 fish, Student’s t-test, *P < 0.05, mean + s.d.). d Zebrafish caudal hematopoietic tissue (CHT) smears stained with May–Grünwald–Giemsa stain in control or fli:hHLXOE embryos at 48 hpf. On the right, cell number counts of the indicated cell populations from 10 fish (n = 3, mean + s.d., Student’s t-test, *P < 0.05). e EDU assay at 48 hpf in control, hlx1 morphants (hlx1MO) or fli:hHLXOE zebrafish cells (n = 2). f Zebrafish CHT smears stained with May–Grünwald–Giemsa stain in control or Runx:hHLXOE embryos at 5 dpf. On the right, cell number counts of the indicated cell populations from 10 fishes, in two independent experiments (mean + s.d., Student’s t-test, **P < 0.01, ****P < 0.0001). g WISH for runx1 and rag1 in control or hlx1MO embryos at 36 and 96 hpf, respectively. h Representative images of Tg(Runx:mCherry) embryos at 72 hpf, injected or not with hlx1 morpholino and the indicated amounts of fli:hHLX construct. Numbers of mCherry-positive HSPCs from each embryo are represented in the graph (n = 10; mean + s.d., Student’s t-test, *P < 0.05, ***P < 0.001) |

ZFIN is incorporating published figure images and captions as part of an ongoing project. Figures from some publications have not yet been curated, or are not available for display because of copyright restrictions. |
|
ZFIN is incorporating published figure images and captions as part of an ongoing project. Figures from some publications have not yet been curated, or are not available for display because of copyright restrictions. PHENOTYPE:
|
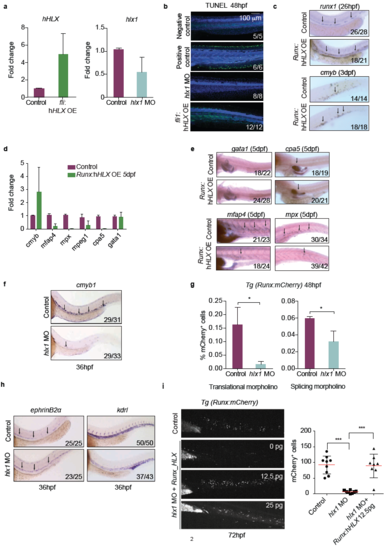
hlx1 regulates hematopoietic stem cell specification and definitive myelopoiesis in zebrafish (a) qPCR analysis for hlx1 expression in fli:hHLXOE endothelial cells and hlx1MO embryos (n=2: mean +s.d.). (b) TUNEL assay at 48hpf in hlx1MO or fli:hHLXOE embryos. The positive control was treated with DNase. Numbers in the bottom right corner of panels indicate numbers of zebrafish embryos with the indicated phenotype, versus the total number of zebrafish analyzed (n=3). (c) WISH for runx1 at 26hpf and c-myb at 72hpf, in control or Runx:hHLXOE embryos. Numbers in the bottom right corner as described above. (d) qPCR results for c-myb and terminal myeloid markers as indicated, in control and Runx:hHLXOE whole embryos at 5dpf. (n=2, mean +s.d.). (e) WISH for terminal myeloid markers as indicated, in control or Runx:hHLXOE embryos at 5dpf. Numbers in the bottom right corner as described above. (f) WISH for c-myb, in control or hlx1MO embryos at 36hpf. Numbers in the bottom right corner as described above. (g) Graphs depicting the percentage of Runx+ HSPCs in control Tg(Runx:mCherry) or hlx1MO injected with either a translational or a splicing morpholino at 48hpf measured by flow cytometry (n=3; mean + s.d.; Student’s t-test, *P<0.05). (h) WISH for ephrinB2α (arterial endothelium) and kdrl (vascular endothelium) in control or hlx1 MO embryos at 36hpf. Numbers in the bottom right corner as described above. (i) Representative images of Tg(Runx:mCherry) embryos at 72hpf, injected with hlx1 morpholino and the indicated amounts of Runx:hHLX construct. The numbers of mCherry-positive HSPCs from each embryo are represented in the graph (mean + s.d., ANOVA test, ***P<0.001). |