
- Title
-
Identification of a neuronal population in the telencephalon essential for fear conditioning in zebrafish
- Authors
- Lal, P., Tanabe, H., Suster, M.L., Ailani, D., Kotani, Y., Muto, A., Itoh, M., Iwasaki, M., Wada, H., Yaksi, E., Kawakami, K.
- Source
- Full text @ BMC Biol.
Gal4FF transgenic fish lines that showed deficits in the active avoidance response and had expression patterns in the Dm. a–f Performance of two-way active avoidance response of wild type fish (n = 28) (Fig. 2 and shown in dotted lines) and double transgenic fish that are created by crossing the Gal4FF transgenic fish with the UAS:zBoTxBLC:GFP fish. a SAGFF36B (n = 10). (b) SAGFF70A (n = 22). (c) SAGFF120A (n = 10). d SAGFF228A (n = 10). e SAGFF231A (n = 13). f SAGFF234D (n = 11). Means ± SEM and avoidance (%) for individual fish are plotted. g Comparison of performance of avoidance responses at day 5 with Tukey box plot. Mean is marked by ‘+’. Two-way ANOVA, fish groups (CS-US wild type, CS only wild type described in Fig. 2c, d and all double transgenic fish including fish described in Additional file 2: Figure S1) x training days (day 1, day 5), was performed (F = 7.236, P < 0.0001). Dunnett’s multiple comparison post-hoc tests were performed between wild type and double transgenic fish on day 5. *P < 0.05, **P < 0.01, ***P < 0.001, and ****P < 0.0001. ns, not significant (P > 0.05). h A coronal view of the zebrafish telencephalon. Dm, medial zone of dorsal telencephalic area (D); Dl, lateral zone of D; Dc, central zone of D; Dp, posterior zone of D; SY, sulcus ypsiloniformis; Vd, dorsal nucleus of ventral telencephalic area (V); Vv, ventral nucleus of V; EN, entopeduncular nucleus. i–n GFP expression patterns in the coronal section of the Gal4FF;UAS:GFP transgenic fish with magnified views of Dm. The Gal4FF transgenic fish are crossed with UAS:GFP effector fish. i SAGFF36B. j SAGFF70A. k SAGFF120A. l SAGFF228A. m SAGFF231A. n SAGFF234D. Scale bars, 200 μm |
SAGFF70A and SAGFF120A are enhancer trap lines of the emx3 gene. a Transposon integration sites in the SAGFF70A and SAGFF120A transgenic fish. b, c In situ hybridization analysis of the adult brain using the emx3 probe. b Coronal section, scale bar 200 μm. c Sagittal section, scale bar 500 μm |
Immunohistochemical analyses of the 120A-Dm neurons. a Fluorescence imaging of the brain of SAGFF120A;UAS:GFP fish from the dorsal side. Dm, medial zone of the dorsal telencephalic area. Scale bars, 500 μm. b–d Double immunofluorescence staining of the telencephalon of SAGFF120A;UAS:GFP fish using the anti-GFP (green) (b) and anti-NeuN (magenta; neuronal marker) (c) antibodies. d A merged image; 16% (1986/12282) of NeuN-positive cells were GFP-positive and 99% (2394/2423) of GFP-positive cells were NeuN-positive. e A coronal view of the zebrafish telencephalon. Dm, medial zone of dorsal telencephalic area (D); Dl, lateral zone of D; Dc, central zone of D; Dp, posterior zone of D; SY, sulcus ypsiloniformis; Vd, dorsal nucleus of ventral telencephalic area (V); Vv, ventral nucleus of V; EN, entopeduncular nucleus. f Fluorescence in situ hybridization using the vglut1/2.1/2.2 probes. g Fluorescence in situ hybridization using the GAD67 probe. h–j Immunofluorescence staining of the telencephalon of SAGFF120A;UAS:GFP fish using anti-GFP (green) (h) and fluorescence in situ hybridization using vglut1/2.1/2.2 probes (magenta) (i). j A merged image; 94% (352/374) of GFP-positive cells were glutamatergic. Scale bars, 200 μm (f, g) and 50 μm (b–d, h–j) |
Projections of 120A-Dm neurons. a Dorsal view of the brain. The positions of the sections are shown as bars (b–g). b–d Immunofluorescence staining using anti-GFP. b, c Coronal sections of SAGFF70A;UAS:GFP;UAS:zBoTxBLC:GFP fish. d Sagittal section of SAGFF120A;UAS:GFP;UAS:zBoTxBLC:GFP fish. Axons of the 120A-Dm neurons project to the hypothalamus area. Arrowheads in b and c indicate projections from two groups of the 120A-Dm neurons. Arrows in c and d indicate the lateral forebrain bundle. e–g Double immunofluorescence staining using anti-GFP (green) and anti-MAP2 (magenta; dendritic marker) of the brain of SAGFF120A;UAS:GFP fish. Schemes of coronal views of the telencephalon are shown on the left. e Projections to Vd. f Projections to Vs. e, f Arrowheads mark projections that were not co-stained with anti-MAP2. g Projections to the neuropil area of EN and Ppa. Cell bodies in EN and Ppa were stained with DAPI (blue). Dm, medial zone of dorsal telencephalic area (D); Dl, lateral zone of D; Dc, central zone of D; Dp, posterior zone of D; SY, sulcus ypsiloniformis; Vd, dorsal nucleus of ventral telencephalic area (V); Vv, ventral nucleus of V; EN, entopeduncular nucleus; Ppa, Parvocellular preoptic area; Cand, Commissura anterior, pars dorsalis; Cantv, Commissura anterior, pars ventralis. h A schematic view of axonal projections of the 120A-Dm neurons (green) to Vd, Vs, EN, Ppa, and the hypothalamus. i Light-sheet microscopy of a cleared brain from the SAGFF120A;UAS:GFP fish. Horizontal section (left) and coronal sections (right) showed projections of the 120A-Dm neurons terminated in the lateral hypothalamic nucleus (LH), the anterior tuberal nucleus (ATN), and dorsal zone of periventricular hypothalamus (Hd). Scale bars, 200 μm (b–d), 50 μm (e, g), 25 μm (f), and 500 μm (i) |
GFP expression patterns in SAGFF120A;UAS:GFP and SAGFF120A;UAS:GFP;UAS:zBoTxBLC:GFP fish. a–d GFP fluorescence in the dorsal view of the brains from SAGFF120A;UAS:GFP (~10 months old; #4 in Additional file 8: Figure S4) (a, b) and SAGFF120A;UAS:GFP;UAS:zBoTxBLC:GFP (~10 months old; #4 in Additional file 8: Figure S4) fish (c, d). Areas having more GFP intensity than background (the maximum intensity measured in the posterior part of the telencephalon) were identified by using ImageJ [57] and shown in red (b, d). c–p Immunohistochemistry using anti-GFP (green; e, g, i, k, m, o) and anti-NeuN (a neuronal marker, magenta; f, h, j, l, n, p). Coronal sections of the telencephalon (e–l) and the hypothalamus (m–p) of SAGFF120A;UAS:GFP (e, f, i, j, m, n) and SAGFF120A;UAS:GFP;UAS:zBoTxBLC:GFP (g, h, k, l, o, p) fish. i–l Magnified images of e–h. GFP-positive cells in Dm, and projections from these cells to the target area in Hd (dorsal zone of periventricular hypothalamus) were detected. A dotted circle in o indicated a broken part. Scale bars: 1 mm (a, c), 500 μm (b, d), and 200 μm (e–p). q–r Comparisons of total GFP intensity (q) and area (r) data obtained by ImageJ analysis of SAGFF120A;UAS:GFP (n = 8) and SAGFF120A;UAS:GFP;UAS:zBoTxBLC:GFP (n = 8) fish (Additional file 8: Figure S4) are plotted with Tukey box plot. Unpaired t-test with Welch’s correction was performed between these transgenic fish (ns, not significant) |
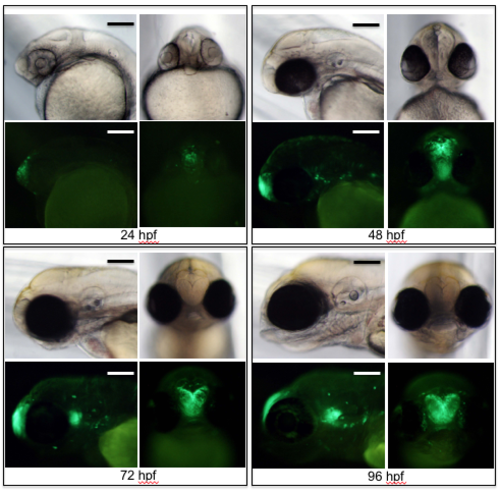
GFP expression patterns in SAGFF120A;UAS:GFP fish at embryonic stages. Bright field and fluorescent images of frontal and lateral views of SAGFF120A;UAS:GFP fish at 24, 48, 72, and 96 hpf. Scale bar, 200 mm. (PPTX 1417 kb) |