
- Title
-
Mecp2 regulates tnfa during zebrafish embryonic development and acute inflammation.
- Authors
- van der Vaart, M., Svoboda, O., Weijts, B.G., Espín-Palazón, R., Sapp, V., Pietri, T., Bagnat, M., Muotri, A.R., Traver, D.
- Source
- Full text @ Dis. Model. Mech.
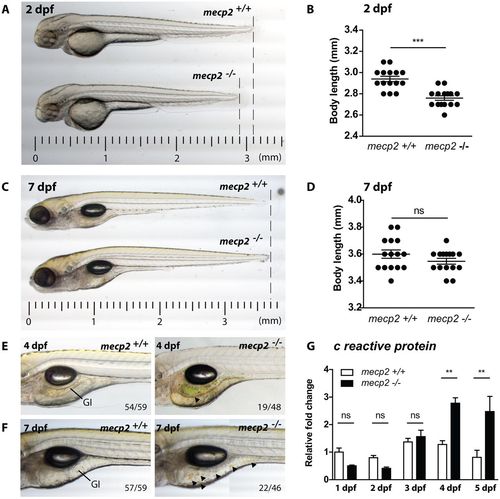
mecp2-deficient zebrafish display inflammation during larval development. (A,C) Representative stereo microscopy images of 2 dpf and 7 dpf wild-type and mecp2-null zebrafish larvae. (B,D) Total body lengths of the 2 dpf and 7 dpf wild-type and mecp2-null larvae, as measured in millimeters (n=15 per condition; Student’s t-test; ***P<0.001; data are representative of three individual experiments). (E,F) Stereo microscopy images of 4 dpf and 7 dpf wild-type and mecp2-null zebrafish illustrating the GI tract phenotypes regularly observed (indicated by arrowheads). The frequency of these phenotypes is shown in relation to the total number of examined animals (19 of 48 mecp2-null animals at 3 dpf; 22 of 46 mecp2-null animals at 7 dpf). (G) qPCR was performed to determine the whole-organism gene expression level of the inflammation marker crp relative to the expression of the housekeeping gene tbp. Wild-type and mecp2-null samples (n=3 with 20 embryos or larvae pooled per sample) were taken every day for the first 5 days of development. The relative fold change versus gene expression in a 1 dpf wild type is shown (one-way ANOVA with Tukey's post hoc test; **P<0.01; ns, not significant; data are representative of two individual experiments). |
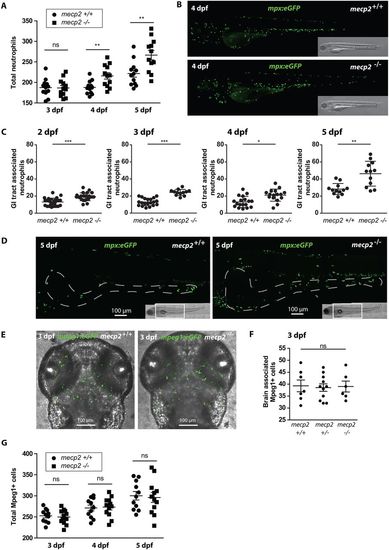
Neutrophil number and distribution confirm the presence of inflammation in mecp2-null larvae. (A) Total numbers of Tg(mpx:eGFP)-positive neutrophils were counted in 3, 4 and 5 dpf wild-type and mecp2-null larvae using stereo fluorescent microscopy (n=12 larvae per condition pooled from two individual experiments; larvae were scored for three consecutive days). (B) Representative stereo microscopy images of 4 dpf Tg(mpx:eGFP) wild-type and mecp2-null larvae. (C) Numbers of Tg(mpx:eGFP)-positive neutrophils associated with the GI tract of 2, 3, 4 and 5 dpf wild-type and mecp2-null larvae were counted (n≥12 embryos per condition; data are representative of three individual experiments). (D) Representative confocal micrographs (maximum projection) of the GI tracts of 5 dpf Tg(mpx:eGFP) wild-type and mecp2-null larvae in which the GI tract has been delineated with a white dashed line based on the transmitted light images. (E) Representative confocal micrographs (maximum projection) of the brain region of 3 dpf Tg(mpeg1:eGFP) wild-type and mecp2-null larvae. (F) Brain-associated Tg(mpeg1:eGFP)-positive cells were counted for 3 dpf wild-type, heterozygous and mecp2-null larvae (n=7, n=11, n=6, respectively; one-way ANOVA with Tukey's post hoc test; ns, not significant; data are representative of two individual experiments). (G) Total numbers of Tg(mpeg1:eGFP)-positive cells were counted in 3, 4 and 5 dpf wild-type and mecp2-null larvae using stereo fluorescent microscopy (n=11 and n=12 embryos per condition, respectively; data are representative of two individual experiments). A Student’s t-test was used for all statistical analyses, except for the data analyzed in F, by comparing wild-type and mecp2-null numbers per day (***P<0.001; **P<0.01; *P<0.05; ns, not significant). EXPRESSION / LABELING:
|
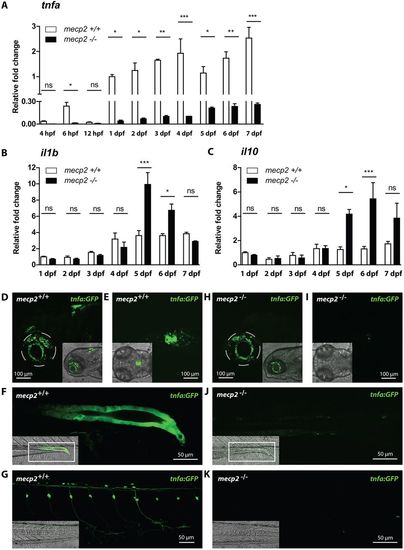
Expression of central inflammatory cytokines is dysregulated in mecp2-null larvae. (A,B,C) qPCR was performed to determine the whole-organism expression of tnfa from 4 hpf to 7 dpf (A), and il1b and il10 from 1 dpf to 7 dpf (B,C), in wild-type or mecp2-null zebrafish. Gene expression is related to the expression of the housekeeping gene tbp, where the fold change relative to gene expression in 1 dpf wild-type embryos is shown (n=3 with 20 embryos or larvae pooled per sample for 1-7 dpf; 30 embryos were pooled per sample for the 4-12 hpf time points; data are representative of two individual experiments). One-way ANOVA with Tukey's post hoc test was used for all statistical analyses (***P<0.001; **P<0.01; *P<0.05; ns, not significant). (D-K) Representative confocal micrographs of 3 dpf Tg(tnfa:eGFP) wild-type and mecp2-null larvae showing the eGFP expression pattern in brain regions in a lateral view (D,H), brain regions in a dorsal view (E,I), posterior gut epithelium in a lateral view (F,J) and dorsal root ganglion neurons in a lateral view (G,K). |
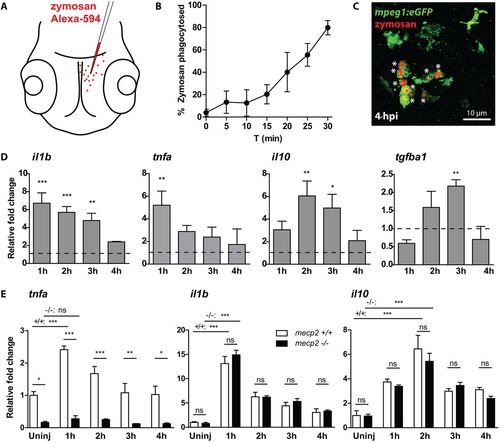
mecp2-null larvae are unable to increase tnfa expression during an acute inflammatory response. (A) Schematic of the injection of Alexa Fluor 594-labeled zymosan into the brains of 3 dpf zebrafish larvae. (B) The percentage of zymosan particles phagocytosed by Tg(mpeg1:eGFP)-positive cells in wild-type larvae was determined using confocal microscopy of samples fixed every 5 min after injection (n=5 larvae per time point). (C) Representative confocal micrograph of a wild-type Tg(mpeg1:eGFP) larva at 4 hpi. Asterisks indicate zymosan particles phagocytosed by Tg(mpeg1:eGFP)-positive cells. (D) qPCR was performed to determine the whole-organism gene expression level of il1b, tnfa, il10 and tgfb1 relative to the expression of the housekeeping gene tbp. Samples (n=3 with 10 embryos per sample) were taken at 1, 2, 3 and 4 hpi of zymosan or PBS as a control. The relative fold change of zymosan- versus PBS-injected samples is shown for each time point to account for a possible wounding effect by the injection itself. (E) qPCR was performed to determine the whole-organism expression level of il1b, tnfa, il10 and tgfb1 relative to the expression of the housekeeping gene tbp. Wild-type or mecp2-null samples (n=3 with 10 embryos per sample) were taken at 1, 2, 3 and 4 hpi of zymosan. The relative fold change of zymosan-injected larvae versus uninjected wild-type controls is shown for each time point to not exclude a potential different response in mecp2-null samples towards the wound caused by the injection. One-way ANOVA with Tukey's post hoc test was used for all statistical analyses (***P<0.001; **P<0.01; *P<0.05; ns, not significant; data are representative of at least two individual experiments). EXPRESSION / LABELING:
PHENOTYPE:
|
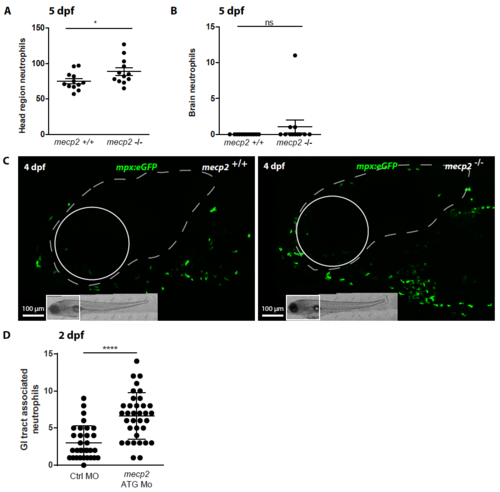
Neutrophil numbers in the head and brain region of wild type and mecp2- null larvae (A) Tg(mpx:eGFP)-positive neutrophils were enumerated in the head region of 5 dpf wild type and mecp2-null larvae using stereo fluorescent microscopy (n=12 embryos per condition). (B) Numbers of Tg(mpx:eGFP)-positive neutrophils present in the brain were counted for wild type and mecp2-null larvae at 5 dpf (n=12 embryos per condition). (C) Representative stereo microscopy images of the head region of 5 dpf Tg(mpx:eGFP) wild type and mecp2-null larvae in which the brain tissue has been indicated with a white dotted line. A Mann–Whitney U test was used for statistical analysis (*: p<0.05; ns: not significant). (D) Oligonucleotide morpholino targeting mecp2 expression was injected as previously described by Gao et al. (2015). Numbers of Tg(mpx:eGFP)-positive neutrophils associated with the gastrointestinal tract of 2 dpf control and mecp2 morpholino injected larvae were counted (n≥30 embryos per condition). Student T-test was used for the statistical analyses (***: p<0.001). |

ZFIN is incorporating published figure images and captions as part of an ongoing project. Figures from some publications have not yet been curated, or are not available for display because of copyright restrictions. |
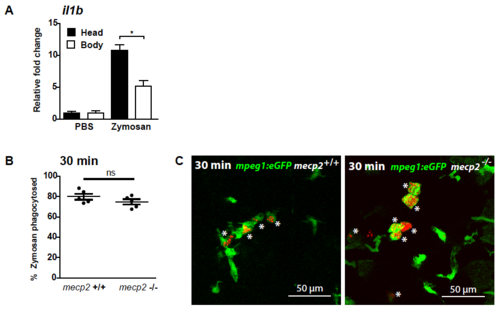
Microinjection of zymosan into the brain of zebrafish larvae (A) Zymosan was injected into the brain of 3 dpf wild type larvae. Quantitative real-time PCR was performed to determine gene expression level of il1b relative to the expression of the housekeeping gene tbp in the dissected heads and bodies of injected larvae. Samples (n=3 with 10 heads or bodies per sample) were taken at 1 hour post injection of zymosan or PBS as a control. The relative fold change of zymosan versus PBS injected samples is shown to account for a possible wounding effect by the injection itself. A One-way ANOVA with Tukey’s post hoc test was used for statistical analysis (*: p<0.05; ns: not significant). (B) The percentage of zymosan particles phagocytes by Tg(mpeg1:eGFP)- positive cells for wild type and mecp2-null larvae using confocal microscopy of samples fixed 30 minutes after injection (n=5 larvae per condition). A Student T-test was used for statistical analysis (ns: not significant). (C) Representative confocal micrographs of a wild type and mecp2-null Tg(mpeg1:eGFP) larvae at 30 minutes post injection. An asterix (*) indicates zymosan phagocytosed by Tg(mpeg1:eGFP)-positive cells. EXPRESSION / LABELING:
PHENOTYPE:
|