
- Title
-
Myotome adaptability confers developmental robustness to somitic myogenesis in response to fibre number alteration
- Authors
- Roy, S.D., Williams, V.C., Pipalia, T.G., Li, K., Hammond, C.L., Knappe, S., Knight, R.D., Hughes, S.M.
- Source
- Full text @ Dev. Biol.
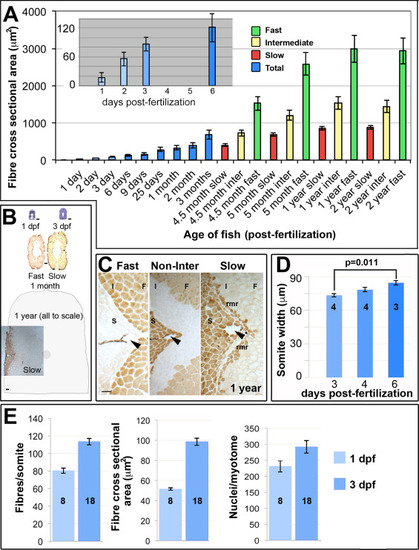
Muscle growth involves increase in fibre number and size. A. Fibre cross sectional area from unfixed cryosections as a function of age and fibre type in single average-sized fish at each age. Mean±SEM from 80 to 250 fast fibres and all slow and intermediate fibres in midbody somites. Inset magnifies early stages. B. Toluidine blue and myosin stained midbody sections at same scale Schematic indicates approximate size of entire section at 1 year. C. Immunodetection distinguishes fast (F), intermediate (I) and slow (S) fibres including the red muscle rim (rmr) from 4.5 months. Arrowheads indicate the lateral line. D. Mediolateral width of somite measured at horizontal myoseptum from wholemount confocal stacks. E. Fibres and nuclei were counted and cross sectional area measured on YZ confocal sections of somite 16–20 from 8 and 18 lightly-fixed Hoechst-stained Tg(Ola.Actb:Hsa.HRAS-EGFP) embryos at 1 and 3 dpf, respectively. As small fibres are hard to count with confidence in fixed preparations, fibre numbers represent minimal estimates. Note that the 1 dpf values for fibre cross sectional area are significantly larger in wholemount measurements (E) compared to cryosectioned material (A), possibly due to methodological and/or lay-to-lay variation. Bars 50 µm. |
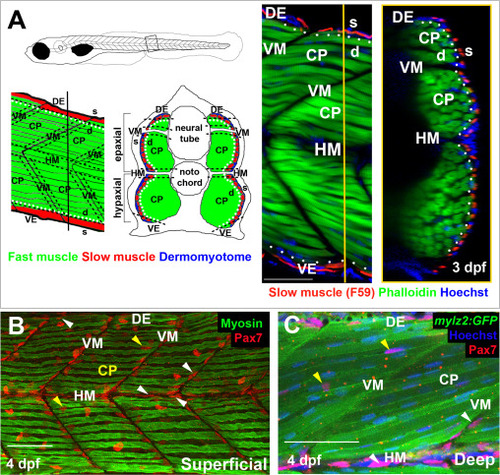
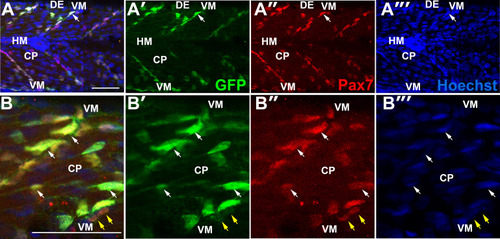
Spatial distribution of Pax7+ cells in growing myotome. A. Somites at the trunk/tail border shown schematically to define myotomal regions. Schematics (left panels) and confocal optical sections (right panels) of 3 dpf Tg[mylz2:GFP] (green) fish showing slow myosin (red) and nuclei (blue) in lateral (left; anterior to left, dorsal top) and transverse (right; dorsal to top, medial left) views. Epaxial (dorsal) and hypaxial (ventral) somite was conceptually segmented first into superficial (s; dermomyotome and underlying slow fibre layer, judged as about one nuclear length (~6 µm) from the peri/epidermal surface) and deep (d; fast myotomal and myosepta) domains (separated by dots). Within each domain, a central portion (CP) was distinguished from myoseptal border regions lying within a nuclear length (~6 µm) of the somite surface (indicated by dashes). Vertical myoseptum (VM; at which fibre ends from adjacent somites meet), horizontal myoseptum (HM; at which muscle pioneer cells and the lateral line separate epaxial and hypaxial somite domains) and dorsal and ventral edges of the DM (DE/VE; at which the lateral and medial myotome surfaces meet and nascent fibres form (Barresi et al., 2001; Johnston et al., 2009) were distinguished. B,C. Single confocal slices from wholemount 4 dpf larvae taken in lateral view, orientated with dorsal to top and anterior to left. Wt (B) or Tg(−2.2mylz2:GFP)i135 (C) larvae stained with anti-Pax7, Hoechst 33342 (detecting nuclei) and either A4.1025 (B, detecting sarcomeric MyHC) or anti-GFP (C). The superficial monolayer of slow muscle fibres aligned parallel to the horizontal myoseptum (HM) in somites 15–18 (B). Pax7+ nuclei surround the myotome (white arrowheads) at dorsal edge (DE), HM and vertical myoseptum (VM) and also occur in central portion (CP; yellow arrowheads) in both the epaxial and hypaxial domains. Pax7+ cells nestle amongst deeper fast fibres orientated oblique to HM in the CP region of the epaxial myotome (C). Bars 50 µm. |
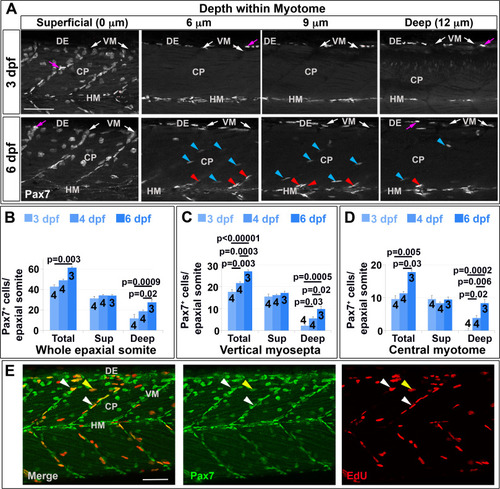
Pax7+ nuclei increase in deep myotome. Pax7 (A-E) and EdU (E) labelling in wholemount wt larvae. Single confocal slices of zebrafish larvae in lateral view. A: Flattened dehydrated embryos imaged at the indicated depths (full larval thickness approximately 35 µm). At 3 dpf, MPCs accumulate superficially near VM (white arrows) but are absent deeper within myotome. Xanthophores (purple arrows) are rare and bright. By 6 dpf, Pax7+ nuclei appear deep at the VM (red arrowheads) and CP (blue arrowheads). B-D: Numbers of Pax7+ nuclei in epaxial somites 16–18 of whole mount larvae increase with age. Mean±S.E.M. The small error bars indicate tight regulation of Pax7+ cell numbers. Number of embryos scored is indicated within the columns. E: Co-localization of Pax7 and EdU in MPCs of 4 dpf larva both at VM (white arrowheads) and CP (yellow arrowheads). Vertical myoseptum (VM), central portion (CP), horizontal myoseptum (HM), dorsal edge (DE). Bars 50 µm. |
|
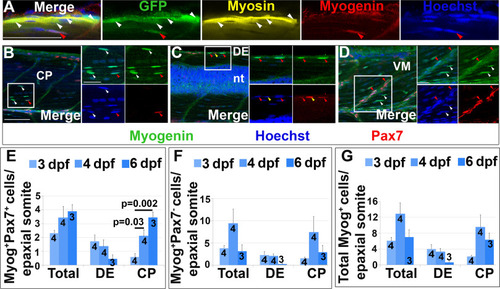
Pax7+ cells differentiate in specific somite regions. Single confocal planes of 4 dpf wholemount immunofluorescence in lateral view. Scale bars 50 µm. A. pax7a:GFP;pfe/pfe larva showing GFP in a MyHC+ muscle fibre (white arrowheads). A deep GFP+MyHC- cell co-labels with Myogenin (red arrowheads). B-D. Pax7 and Myogenin in epaxial somite of wt larva showing Pax7+Myog+ cells (red arrowheads) in CP (B), DE (C) and VM (D), Pax7+Myog- cells (yellow arrowheads) in DE (C) and Pax7-Myog+ cells (white arrowheads) in CP (B,D). Note the reduced Pax7 and Myog signal in Pax7+Myog+ cells. E-G. Time course and location of Myog+Pax7+ (E), Myog+Pax7- (F) and total Myog+ (G) cells. |
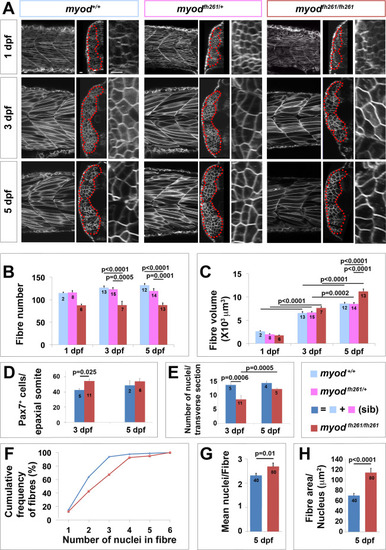
Lack of myod alters somite growth. A. Single confocal planes of myodfh261 mutant and sibling zebrafish expressing plasma membrane-GFP from Tg(Ola.Actb:Hsa.HRAS-EGFP)vu119. Individual retrospectively-genotyped larvae are shown at comparable levels in somites 16–18 at successive stages in each tryptich in lateral (left), transverse (centre) and magnified transverse (right) views. The somite is outlined (red dots). Bars 10 µm. B. Fibre number per somite in each stage and genotype as indicated in key. Note that sibling fibre numbers at 1 dpf are higher than those in Fig. 1E, perhaps because sequential live scanning means that ‘1 dpf’ fish are on average ~4 h older than in fixed preparations. C. Mean fibre volume = myotome volume/fibre number. D,E. Larvae from myodfh261 heterozygote incross were stained at 3 and 5 dpf for Pax7, MyHC and DNA and analysed by confocal microscopy. Pax7+ cell number/epaxial somite (D) and number of nuclear profiles within the myotome/transverse optical section of epaxial somite 17 (E) were scored from fish genotyped by loss of head myogenesis. F-H. Analysis of nuclear number in fast fibres of myodfh261 mutant and sibling Tg(Ola.Actb:Hsa.HRAS-EGFP)vu119 injected with RNA encoding H2B-mCherry to permit counting in live larvae. Fibres analysed (number on columns) are shown in Fig. S5. A cumulative frequency plot (F) reveals the larger number of nuclei in fibres of mutants, which is reflected in an average of 16% increase in nuclear number (G) accompanied by a 63% increase in fibre cross-sectional area per nucleus (H), reflecting an 80% increase in fibre size. Differences tested by ANOVA with Tukey post-hoc (B,C), Kruskall-Wallis (F,G) and t-test (E,H). |
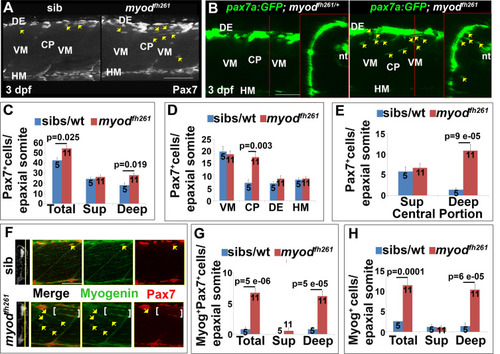
Premature ingression of Pax7+ myogenic precursors in myodfh261 mutants. Wholemount larvae from a myodfh261/+ incross stained for Pax7 (A,C-H) or pax7a:GFP;myodfh261/+ incross imaged live (B) at 3 dpf and shown in confocal short stacks in lateral view. A. Pax7 antibody stained nuclei (arrows) within the deep CP myotome. B. Pax7:GFP+ cells (arrows) in lateral and transversal views. C-H. Comparison of Pax7+ (C-E), Myog+Pax7+ (G) and Myog+ (H) cell numbers in the epaxial half of som16-18 between the number of myodfh261 mutants and their siblings indicated within columns. The extra Pax7+ cells in myodfh261 mutants (C) were specifically located in deep CP (D,E). Lateral planes at deep locations indicated by yellow line on transversal sections of wholemount larvae stained for Pax7, Myogenin and Hoechst (F) reveal increased numbers of Myog+ and Pax7+Myog+ in the deep CP (arrows). Note the alignment of some Myog+ nuclei (brackets). VM: vertical myosepta, CP: central portion, DE: dorsal edge, HM: horizontal myoseptum. Bars 50 µm. |
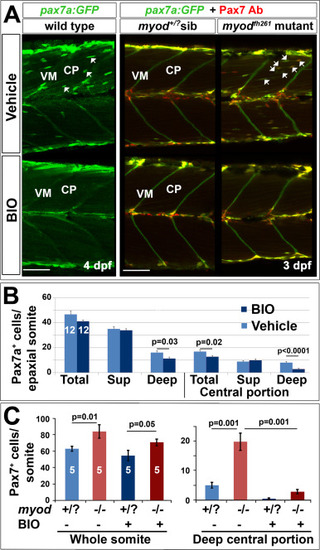
Blockade of ingression of Pax7a+ cells by BIO. The pax7a:GFP BAC transgene was bred onto a pfe/pfe background to diminish xanthophores (left panels). Such fish bred onto myodfh261/+ were in-crossed (right panels) and genotyped by sequencing. Larvae treated for 24 h with BIO or vehicle were stained in wholemount for GFP, Myog and DNA (left panels) or GFP, Pax7 (right panels). Confocal images are maximum intensity projections of short stacks in the deep myotome in lateral view with dorsal up and anterior to left, showing the decline of GFP+ cells (arrows) between fibres in the deep central myotome. VM vertical borders, CP central portion. Bars 50 µm. B. Number of pax7a:GFP+ cells in epaxial region of somites 16–18 of 12 BIO-treated 4 dpf embryos compared with 12 controls. Significantly fewer Pax7a+ cells were present deep within the somite, which was accounted for by highly significant loss from the deep CP. Sup = superficial. C. Larvae from an incross of pax7a:GFP;myodfh261/+ were sorted for GFP, treated at 2.25 dpf with BIO or vehicle, stained at 3.25 dpf for GFP, Pax7 and myosin and genotyped by head muscle. Total (left) and deep CP (right) Pax7+ cells were counted from confocal stacks of five larvae in each condition and differences tested by ANOVA with Bonferroni multiple comparison test. |
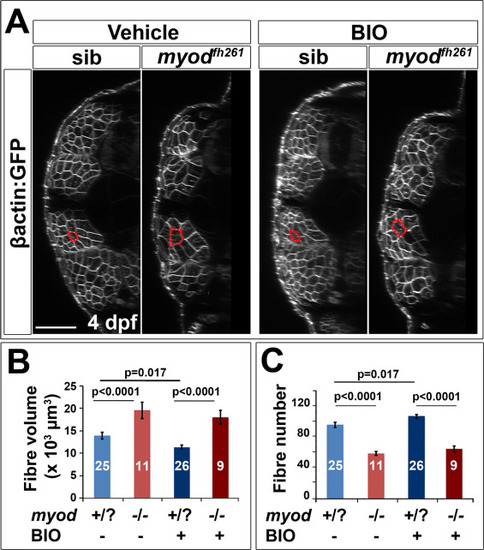
BIO does not prevent fibre hypertrophy in myodfh261 mutant. A. Larvae from an incross of myodfh261/+;Tg(Ola.Actb:Hsa.HRAS-EGFP)vu119 were sorted for GFP, treated with BIO or vehicle from between 2 and 3 dpf and imaged live at 4 dpf by confocal microscopy. Red outlines highlight typical fast fibres. Bar 50 µm. B,C. Quantification of mean fibre volume (B) and fibre number (C) from two replicate experiments was performed blind. Each larva was retrospectively sequence genotyped and the data pooled. Differences were tested by ANOVA with Bonferroni multiple comparison test. |
pax7a:GFP+ cells co-express Pax7. Wholemount 3.25 dpf pax7a:GFP;pfe/pfe larvae in lateral view with dorsal up and anterior to left after immunodetection of GFP and Pax7, and counterstaining with Hoechst 33342. Single deep confocal slices of two whole somites (A) and epaxial somite (B) are shown. GFP largely co-localizes with Pax7 (white arrows). Pax7+ cell on VM that is not GFP+ (yellow arrows). Scale bars = 50 µm. |
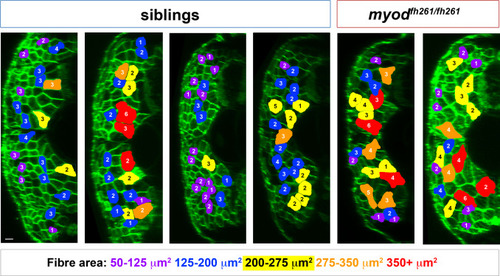
Nuclear counts and size measurement of fast fibres. Transverse views of wholemount 5 dpf larvae from an incross of myodfh261/+;Tg(Ola.Actb:Hsa.HRAS-EGFP)vu119 injected at 1 cell stage with RNA encoding H2B-mCherry (similar to Addgene #20972, red channel not shown). At 5 dpf, fully dual-labelled larvae were scanned in 3D confocal stacks and retrospectively genotyped. Coloured fibres indicate those selected for measurement using the criteria of a) unambiguously delineation of plasma membrane and nuclei and b) distribution throughout the fast myotome of somite 17. The cross-sectional area at the anteroposterior midpoint of each fibre was measured using Volocity v6.3 and the number of nuclei counted manually in twenty fibres in each fish. Note that fibre outline does not perfectly match the shape of fibre because the midpoints of most fibres are in different planes. Size of fibre is colour coded and nuclear number indicated on each fibre. Data for all sibling (80) and all mutant (40) fibres were pooled and presented in Fig. 6F-H. Scale bar = 10 µm. |
Reprinted from Developmental Biology, 431(2), Roy, S.D., Williams, V.C., Pipalia, T.G., Li, K., Hammond, C.L., Knappe, S., Knight, R.D., Hughes, S.M., Myotome adaptability confers developmental robustness to somitic myogenesis in response to fibre number alteration, 321-335, Copyright (2017) with permission from Elsevier. Full text @ Dev. Biol.