
- Title
-
Lef1-dependent hypothalamic neurogenesis inhibits anxiety
- Authors
- Xie, Y., Kaufmann, D., Moulton, M.J., Panahi, S., Gaynes, J.A., Watters, H.N., Zhou, D., Xue, H.H., Fung, C.M., Levine, E.M., Letsou, A., Brennan, K.C., Dorsky, R.I.
- Source
- Full text @ PLoS Biol.

Lef1 promotes neurogenesis in the zebrafish caudal hypothalamus (Hc). (A) Estimation of Hc size in control and lef1 mutants. See S1B Fig for method. (B-F) Immunostaining and quantification in 3 days post-fertilization (dpf) Hc. Representative immunostaining images of Wnt-responsive Tg(top:GFP)+ (B), 5-HT+ and HuC/D+ (C), and mitotic phospho-histone H3-positive (pH3+) cells (E) in control and lef1 mutants are shown on the left and quantified on the right (B1, C1, C2 and E1). Quantification of apoptotic active Caspase3+ (Cas3+) cells on the p53 mutant background is shown in (D), and representative immunostaining images of HuC/D+ cells are shown in (F). (G) Transplantation (schematic on the left) followed by HuC/D immunostaining at 5 dpf. All yellow rectangles depict the region with ventricular HuC/D+ cells normally present in wild-type (wt) fish, and magnified images in (G). All images show ventral views of whole-mounted brain with anterior on top. Data are mean ± SEM, except mean ± SD in (A). ***P < 0.001, **P < 0.01, *P < 0.05, ns. P > 0.05 by unpaired Student t tests. Scale bars: 25 μm. See S1 Table for description of confocal imaging, quantification and experimental n. Raw data can be found in S1 Data. EXPRESSION / LABELING:
PHENOTYPE:
|

Lef1 activates expression of zebrafish hypothalamic genes associated with anxiety. (A) Volcano plot of zebrafish RNA sequencing (RNA-seq) shows differentially expressed genes in the 3 days post-fertilization (dpf) hypothalamus of lef1 mutants compared to control. Only genes with adjusted P value (AdjP) <0.1 (green line) are shown. Genes with an absolute value of log2 ratio >1 (blue lines) are shown in red; others are shown in black. Node size represents the averaged fragments per kilobase of transcript per million mapped reads of a gene in the control. (B) Ingenuity Pathway Analysis (IPA) for zebrafish hypothalamic Lef1-dependent genes revealed 20 genes associated with anxiety and depressive disorder, listed in the table. (C and D) Representative images of whole mount in situ hybridization on 3 dpf control and lef1 mutant embryos for known Wnt targets (C) and genes associated with anxiety and depressive disorder (D). Red and yellow arrows indicate expression in caudal and rostral hypothalamus, respectively. Lateral (axin2, dkk1b, lef1, notum1a, crhbp, and grin2cb) or ventral (other genes) views were selected for optimal expression visualization. Scale bar: 100 μm. EXPRESSION / LABELING:
PHENOTYPE:
|

ZFIN is incorporating published figure images and captions as part of an ongoing project. Figures from some publications have not yet been curated, or are not available for display because of copyright restrictions. PHENOTYPE:
|
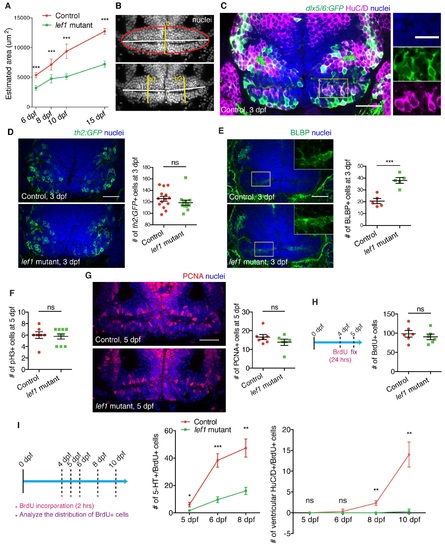
Lef1 promotes neurogenesis in the zebrafish caudal hypothalamus (Hc). (A and B) Hc size in control and lef1 mutants (A) estimated by the area of confocal ventricular slice (B). Hc was defined as an oval indicated by red outline in (B). The lengths of a1, a2, b1, b2 in the representative image (B) were measured by ImageJ, and the area of the oval was calculated by the following equations: Estimated area = π*a*b/4; a = a1+a2; b = (b1+b2)/2. (C) Co-immunostaining of HuC/D and GABAergic lineage marker dlx5/6:GFP [83] in the 3 dpf Hc. Three confocal channel-split magnified images of the region depicted by the yellow rectangle are shown on the right. A representative image is shown for at least 3 embryos tested. (D and E) Immunostaining of th2:GFP+ (D) and BLBP+ cells (E) in the Hc of 3 dpf control and lef1 mutant. Representative images are shown on the left, and quantifications are shown on the right. Higher magnification views of yellow rectangles in single channel are shown in the insets in (E). (F-H) Measurement of proliferation in the Hc of 5 dpf control and lef1 mutant as shown by pH3+ (F) and PCNA+ cells (G; representative image on the left and quantification on the right; cells adjacent to the horizontal ventricle were counted), and 1 day BrdU labeling (H; schematic on the left). (I), BrdU pulse-chase (schematic on the left) to measure birth of 5-HT+ and ventricular HuC/D+ cells after 4 dpf. Data are mean ± SEM, except mean ± SD in (A) and (I). ***P < 0.001, **P < 0.01, *P < 0.05, ns. P > 0.05 by unpaired Student t tests. All images are confocal ventricular slices. All scale bars are 25 μm except 12.5 μm in the magnified image in (C). See S1 Table for description of quantification and experimental n. Raw data can be found in S1 Data. |
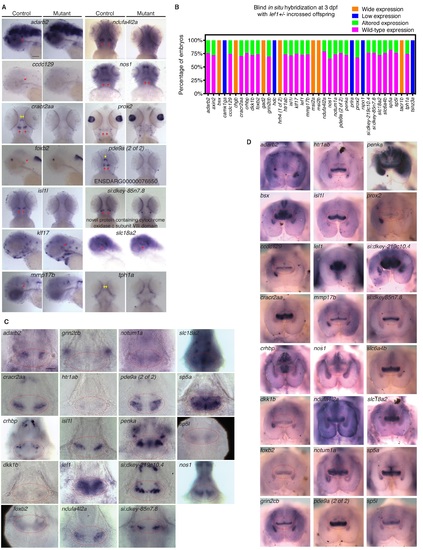
Whole mount in situ hybridization for zebrafish Lef1-dependent genes identified from RNA-seq. (A) Representative images of whole mount in situ hybridization on 3 dpf control and lef1 mutant embryos. Red and yellow arrows indicate gene expression in caudal and rostral hypothalamus, respectively. Lateral (adarb2, ccdc129, foxb2, klf17, mmp17b, and slc18a2) or ventral (other genes) views were selected for optimal expression visualization. (B) Quantification of expression following whole mount in situ hybridization on 3 dpf offspring from lef1+/- incrosses. Fifty to eighty-five embryos were analyzed per gene. (C) Images of 3 dpf control brains centered on Hc from ventral view. (D) Gene expression in the hypothalamus of 4 months post-fertilization (mpf) female wild-type zebrafish from ventral view. Representative images are shown in (C) and (D) for at least 2 samples tested. Images of ventral view have anterior on top; images of lateral view have dorsal on top and anterior on the left. Red dashed outlines in (C) and (D) depict the caudal hypothalamus. Scale bars: 0.1 mm in (A); 5 μm in (C); 0.2 mm in (D). Raw data can be found in S1 Data. |
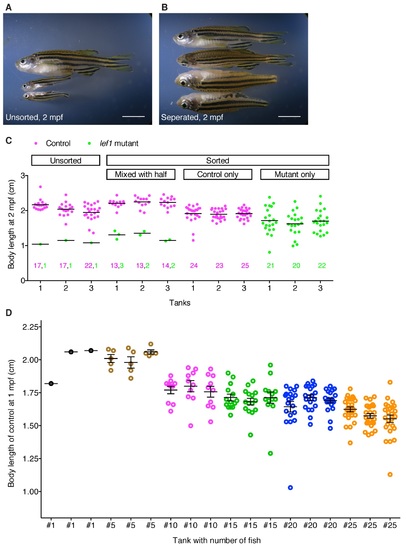
Physiological and behavioral analysis of zebrafish lef1 mutants. (A-C) Body size and survival rate of lef1 mutants under different culture conditions. Offspring of lef1+/- incrosses were either unsorted or sorted by genotype at 15 dpf, and raised at 25 fish per tank. Body length and number of surviving fish at 2 mpf are shown in (C) with representative pictures in (A) and (B) (lef1 mutants have no caudal fins [4]). (D) Body length of wild-type fish with different culture densities [84]. Data are mean ± SEM. Raw data can be found in S1 Data. |
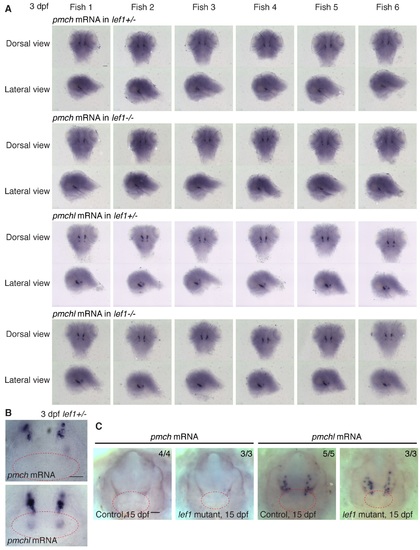
Normal expression of pmch and pmchl in zebrafish lef1 mutants. (A-C) Whole mount in situ hybridization images for pmch and pmchl (pmch, like) in the hypothalamus of 3 dpf (A and B) and 15 dpf (C) zebrafish control and lef1 mutant embryos. Images of dorsal views (anterior on top) and lateral views (dorsal on top and anterior on the left) of the same individual lef1+/- or lef1-/- fish were shown in (A). Representative ventral view images of 3 dpf lef1+/- (B), 15 dpf control and lef1 mutant (C) brains centered on the caudal hypothalamus (dashed red outlines) with anterior on top. Number of fish with representative gene expression among total number of fish is labeled on the right upper corner of each image in (C). Scale bar: 100 μm in (A and C); 5 μm in (B). |