
- Title
-
Masking of a circadian behavior in larval zebrafish involves the thalamo-habenula pathway
- Authors
- Lin, Q., Jesuthasan, S.
- Source
- Full text @ Sci. Rep.
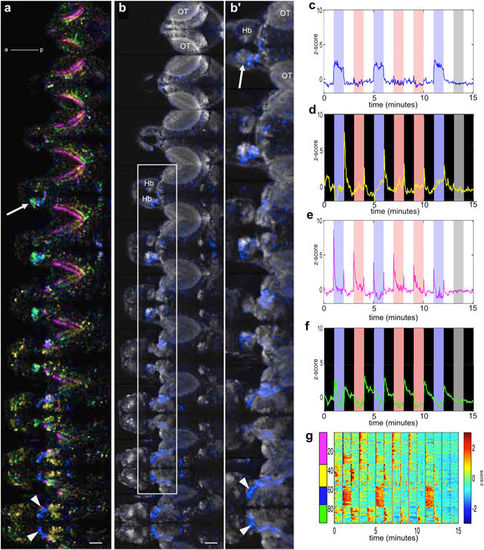
Overview of blue versus red light evoked activity in the brain. (a) Optical sections in a 6 dpf elavl3:GCaMP6f fish, going from dorsal to ventral. Each plane is separated by 10 µm. The area imaged at each plane is 443.47 µm x 222.73 µm. (b) Distribution of light-evoked activity in one fish, generated from ICA spatial maps. The white arrowheads indicate the thalamus, while the arrow indicates the habenula. (b) A magnified view of the area boxed in panel (b). (c–f) Different classes of responses, obtained by PCA followed by ICA. The same colours are used in panel (b). The blue and red bars indicate the periods that blue or red light was delivered. (g) Light-evoked activity in segmented ROIs, which were derived from ICA spatial maps. OT: optic tectum; Hb: habenula; a: anterior; p: posterior. Gamma of 0.65 was applied to panels (a and b). Scale bar = 50 µm. |
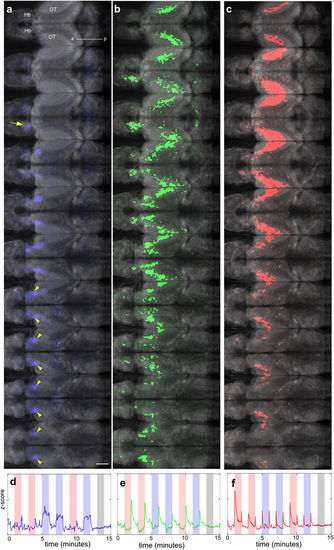
Averaged response of the brain to irradiance change. (a–c) Regions with sustained response to blue light (a), to offset of light (b) and to onset and offset of both blue and red light (c). The corresponding activity traces are shown in panels (d,e and f). These data are compiled from 7 fish. |
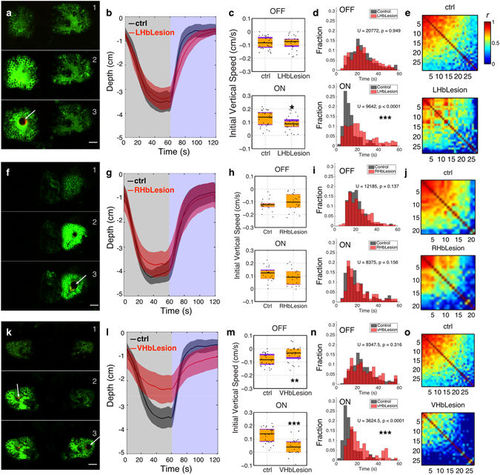
Lesion of the habenula inhibits masking of vertical migration. Effects of lesioning the left dorsal (a–e). N = 29 for control group, 28 for lesion group), right dorsal (f,j). N = 21 for each group) and ventral (k–o). N = 29 for control group, 27 for lesion group) habenula. (a,f,k) Stills from a time-lapse recording taken during the lesioning process, showing the habenula before (top), during (middle) and immediately after (bottom) lesioning. Lesioning leads to the formation of a bubble (arrow) and an extended rise in GCaMP3 fluorescence in surrounding cells. (b,g,l) Average position of fish during light ON and OFF. Shadows represent 95% CIs. (c,h,m) Initial vertical speed during light ON and OFF. Horizontal black lines indicate median values, black dots show individual fish, purple blocks show the 25th and 75th percentiles and orange blocks show 95% CIs. (d,i,n) Time taken to migrate half-way up or down the water column. The bars show the percentage of fish that reach this mark within the indicated time. (e,j,o) Correlation between the movement of individual fish. |