
|
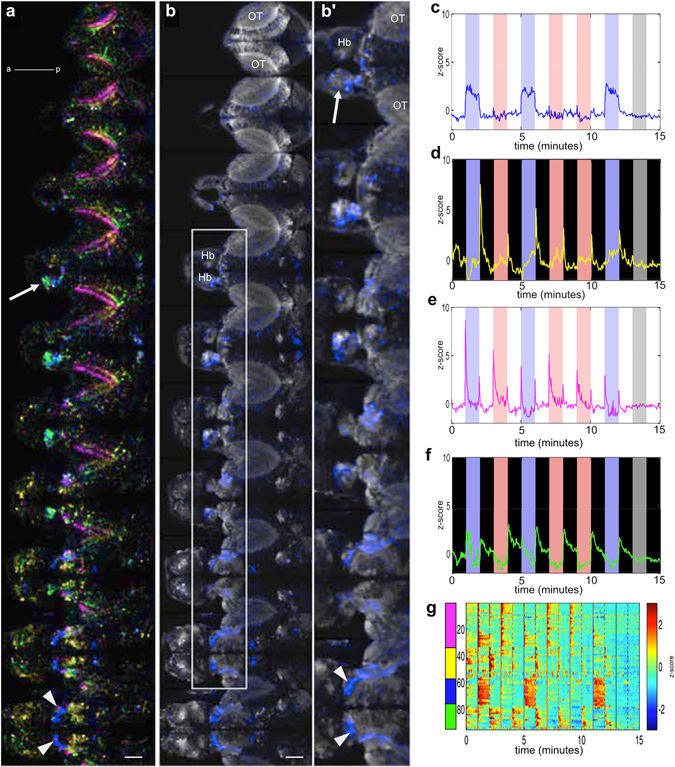
Fig. 5
Overview of blue versus red light evoked activity in the brain. (a) Optical sections in a 6 dpf elavl3:GCaMP6f fish, going from dorsal to ventral. Each plane is separated by 10 µm. The area imaged at each plane is 443.47 µm x 222.73 µm. (b) Distribution of light-evoked activity in one fish, generated from ICA spatial maps. The white arrowheads indicate the thalamus, while the arrow indicates the habenula. (b) A magnified view of the area boxed in panel (b). (c–f) Different classes of responses, obtained by PCA followed by ICA. The same colours are used in panel (b). The blue and red bars indicate the periods that blue or red light was delivered. (g) Light-evoked activity in segmented ROIs, which were derived from ICA spatial maps. OT: optic tectum; Hb: habenula; a: anterior; p: posterior. Gamma of 0.65 was applied to panels (a and b). Scale bar = 50 µm.