
Image
|
Figure Caption
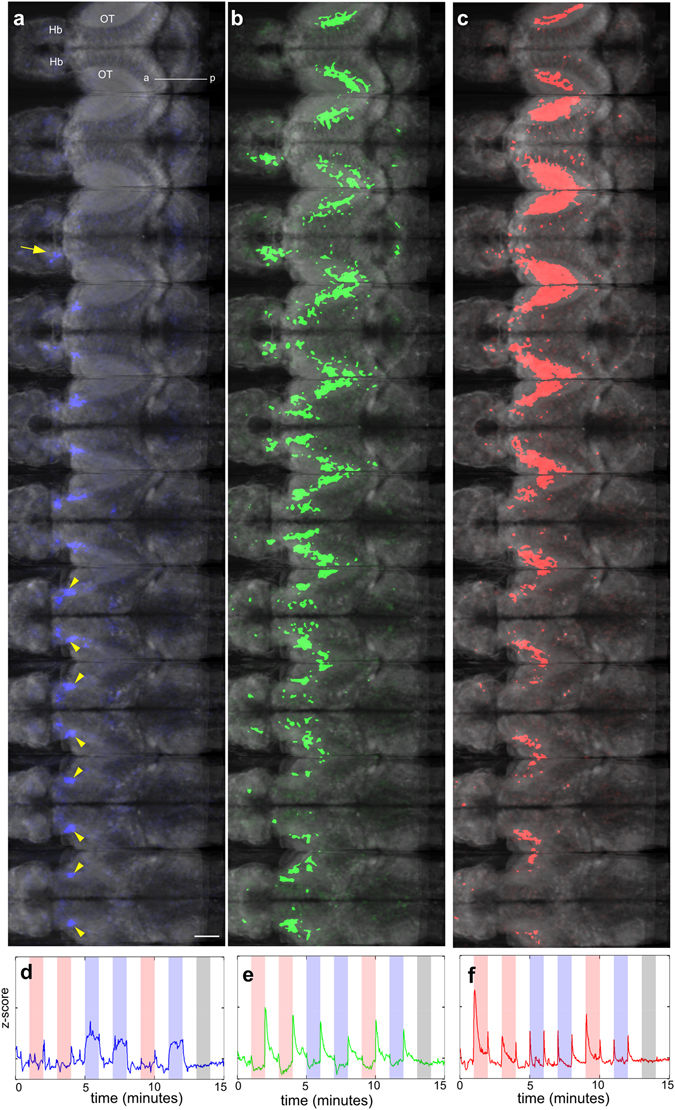
Fig. 6
Averaged response of the brain to irradiance change. (a–c) Regions with sustained response to blue light (a), to offset of light (b) and to onset and offset of both blue and red light (c). The corresponding activity traces are shown in panels (d,e and f). These data are compiled from 7 fish.
Acknowledgments
This image is the copyrighted work of the attributed author or publisher, and
ZFIN has permission only to display this image to its users.
Additional permissions should be obtained from the applicable author or publisher of the image.
Full text @ Sci. Rep.