
|
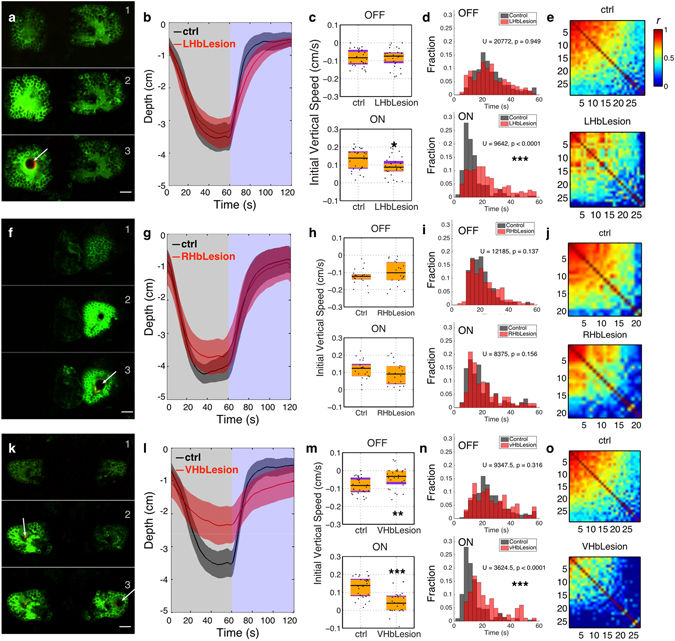
Fig. 7
Lesion of the habenula inhibits masking of vertical migration. Effects of lesioning the left dorsal (a–e). N = 29 for control group, 28 for lesion group), right dorsal (f,j). N = 21 for each group) and ventral (k–o). N = 29 for control group, 27 for lesion group) habenula. (a,f,k) Stills from a time-lapse recording taken during the lesioning process, showing the habenula before (top), during (middle) and immediately after (bottom) lesioning. Lesioning leads to the formation of a bubble (arrow) and an extended rise in GCaMP3 fluorescence in surrounding cells. (b,g,l) Average position of fish during light ON and OFF. Shadows represent 95% CIs. (c,h,m) Initial vertical speed during light ON and OFF. Horizontal black lines indicate median values, black dots show individual fish, purple blocks show the 25th and 75th percentiles and orange blocks show 95% CIs. (d,i,n) Time taken to migrate half-way up or down the water column. The bars show the percentage of fish that reach this mark within the indicated time. (e,j,o) Correlation between the movement of individual fish.