
- Title
-
Chrysophanic Acid Suppresses Adipogenesis and Induces Thermogenesis by Activating AMP-Activated Protein Kinase Alpha In vivo and In vitro.
- Authors
- Lim, H., Park, J., Kim, H.L., Kang, J., Jeong, M.Y., Youn, D.H., Jung, Y., Kim, Y.I., Kim, H.J., Ahn, K.S., Kim, S.J., Choe, S.K., Hong, S.H., Um, J.Y.
- Source
- Full text @ Front Pharmacol
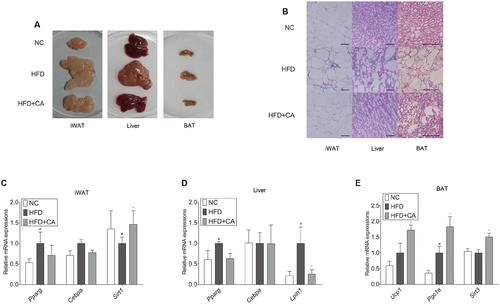
Chrysophanic acid shows inhibitory effects on adipogenesis-related factors in tissues of C57BL/6J mice. (A) Visual comparisons and (B) H&E stainings of iWAT (magnification 200×, scale bar 100 μm), liver (magnification 200×, scale bar 100 μm), and BAT (magnification 400×, scale bar 100 μm) were performed. Real-time RT-PCR analyses of (C) Pparg, Cebpa, and Sirt1 in iWAT, (D) Pparg, Cebpa, and Lipin1 in liver, and (E) Ucp1, Pgc1a, and Sirt3 in BAT were performed. GAPDH was used as endogenous control. Data represent means ± SD of three independent experiments. #p < 0.05 compared with NC, ∗p < 0.05 compared with HFD. NC, normal control group; HFD, high-fat diet group; HFD + CA, high-fat diet plus CA group (n = 5 per group). |
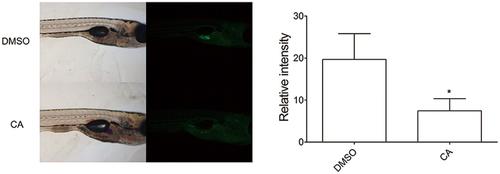
Chrysophanic acid impairs adipocyte development in zebrafish. Zebrafish larvae treated with either DMSO (10 μM) or CA (10 μM) were shown in lateral views with anterior to the right. Both bright-field (Left) and fluorescent images (Right) were paired to visualize the location of adipocytes detected by Nile red. The quantification of the signal intensity from Nile red-positive adipocytes was measured by making multi-point selections of adipocytes using ImageJ. ∗p < 0.05 compared with DMSO-treated control. DMSO, DMSO-treated control group; CA, CA-treated group (n = 15 per group). PHENOTYPE:
|
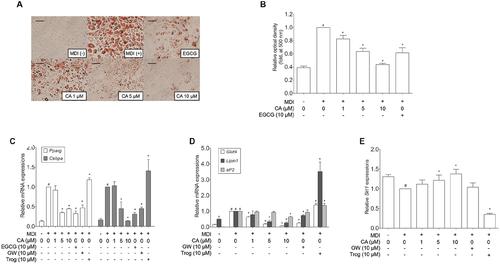
Chrysophanic acid suppresses adipogenic factors in 3T3-L1 adipocytes. (A) An Oil Red O analysis was performed in order to measure the lipid accumulation (magnification 200×, scale bar 100 μm). (B) Relative optic density was measured at 500 nm. Real-time RT-PCR analyses of (C) Pparg, Cebpa, (D) Glut4, Lipin1, aP2, and (E) Sirt1 were performed. EGCG (10 μM) and GW (10 μM) were used as positive controls. Trog (10 μM) was used as a negative control. GAPDH was used as endogenous control. Data represent means ± SD of three independent experiments. #p < 0.05 compared with MDI-uninduced preadipocytes, ∗p < 0.05 compared with MDI-induced adipocytes. MDI, differentiation medium. |
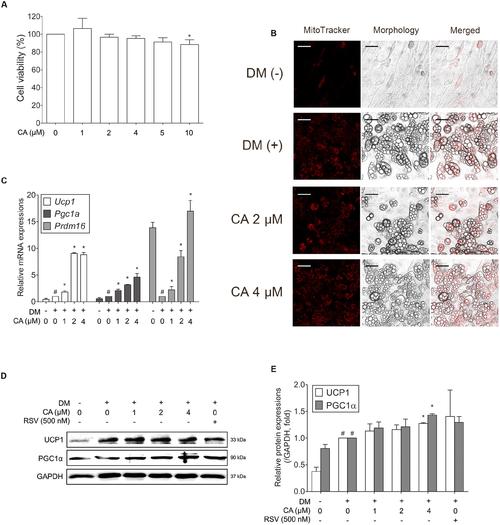
Chrysophanic acid upregulates brown-fat-specific factors at both mRNA and protein levels in primary cultured brown adipocytes. (A) An MTS assay was performed to measure the survival rate of primary cultured brown adipocytes after treatment with CA. (B) Mitochondrial abundance in primary brown adipocytes was analyzed by MitoTracker Red staining (magnification 200×, scale bar 100 μm). (C) Real-time RT-PCR analyses of Ucp1, Pgc1a, and Prdm16 were performed. (D) Western blot analyses of UCP1 and PGC1α were performed. (E) Quantification of the protein bands was measured using ImageJ. RSV (500 nM) was used as a positive control. GAPDH was used as endogenous control. Data represent means ± SD of three independent experiments. #p < 0.05 compared with DM-uninduced preadipocytes, ∗p < 0.05 compared with DM-induced adipocytes. DM, differentiation medium. |