
|
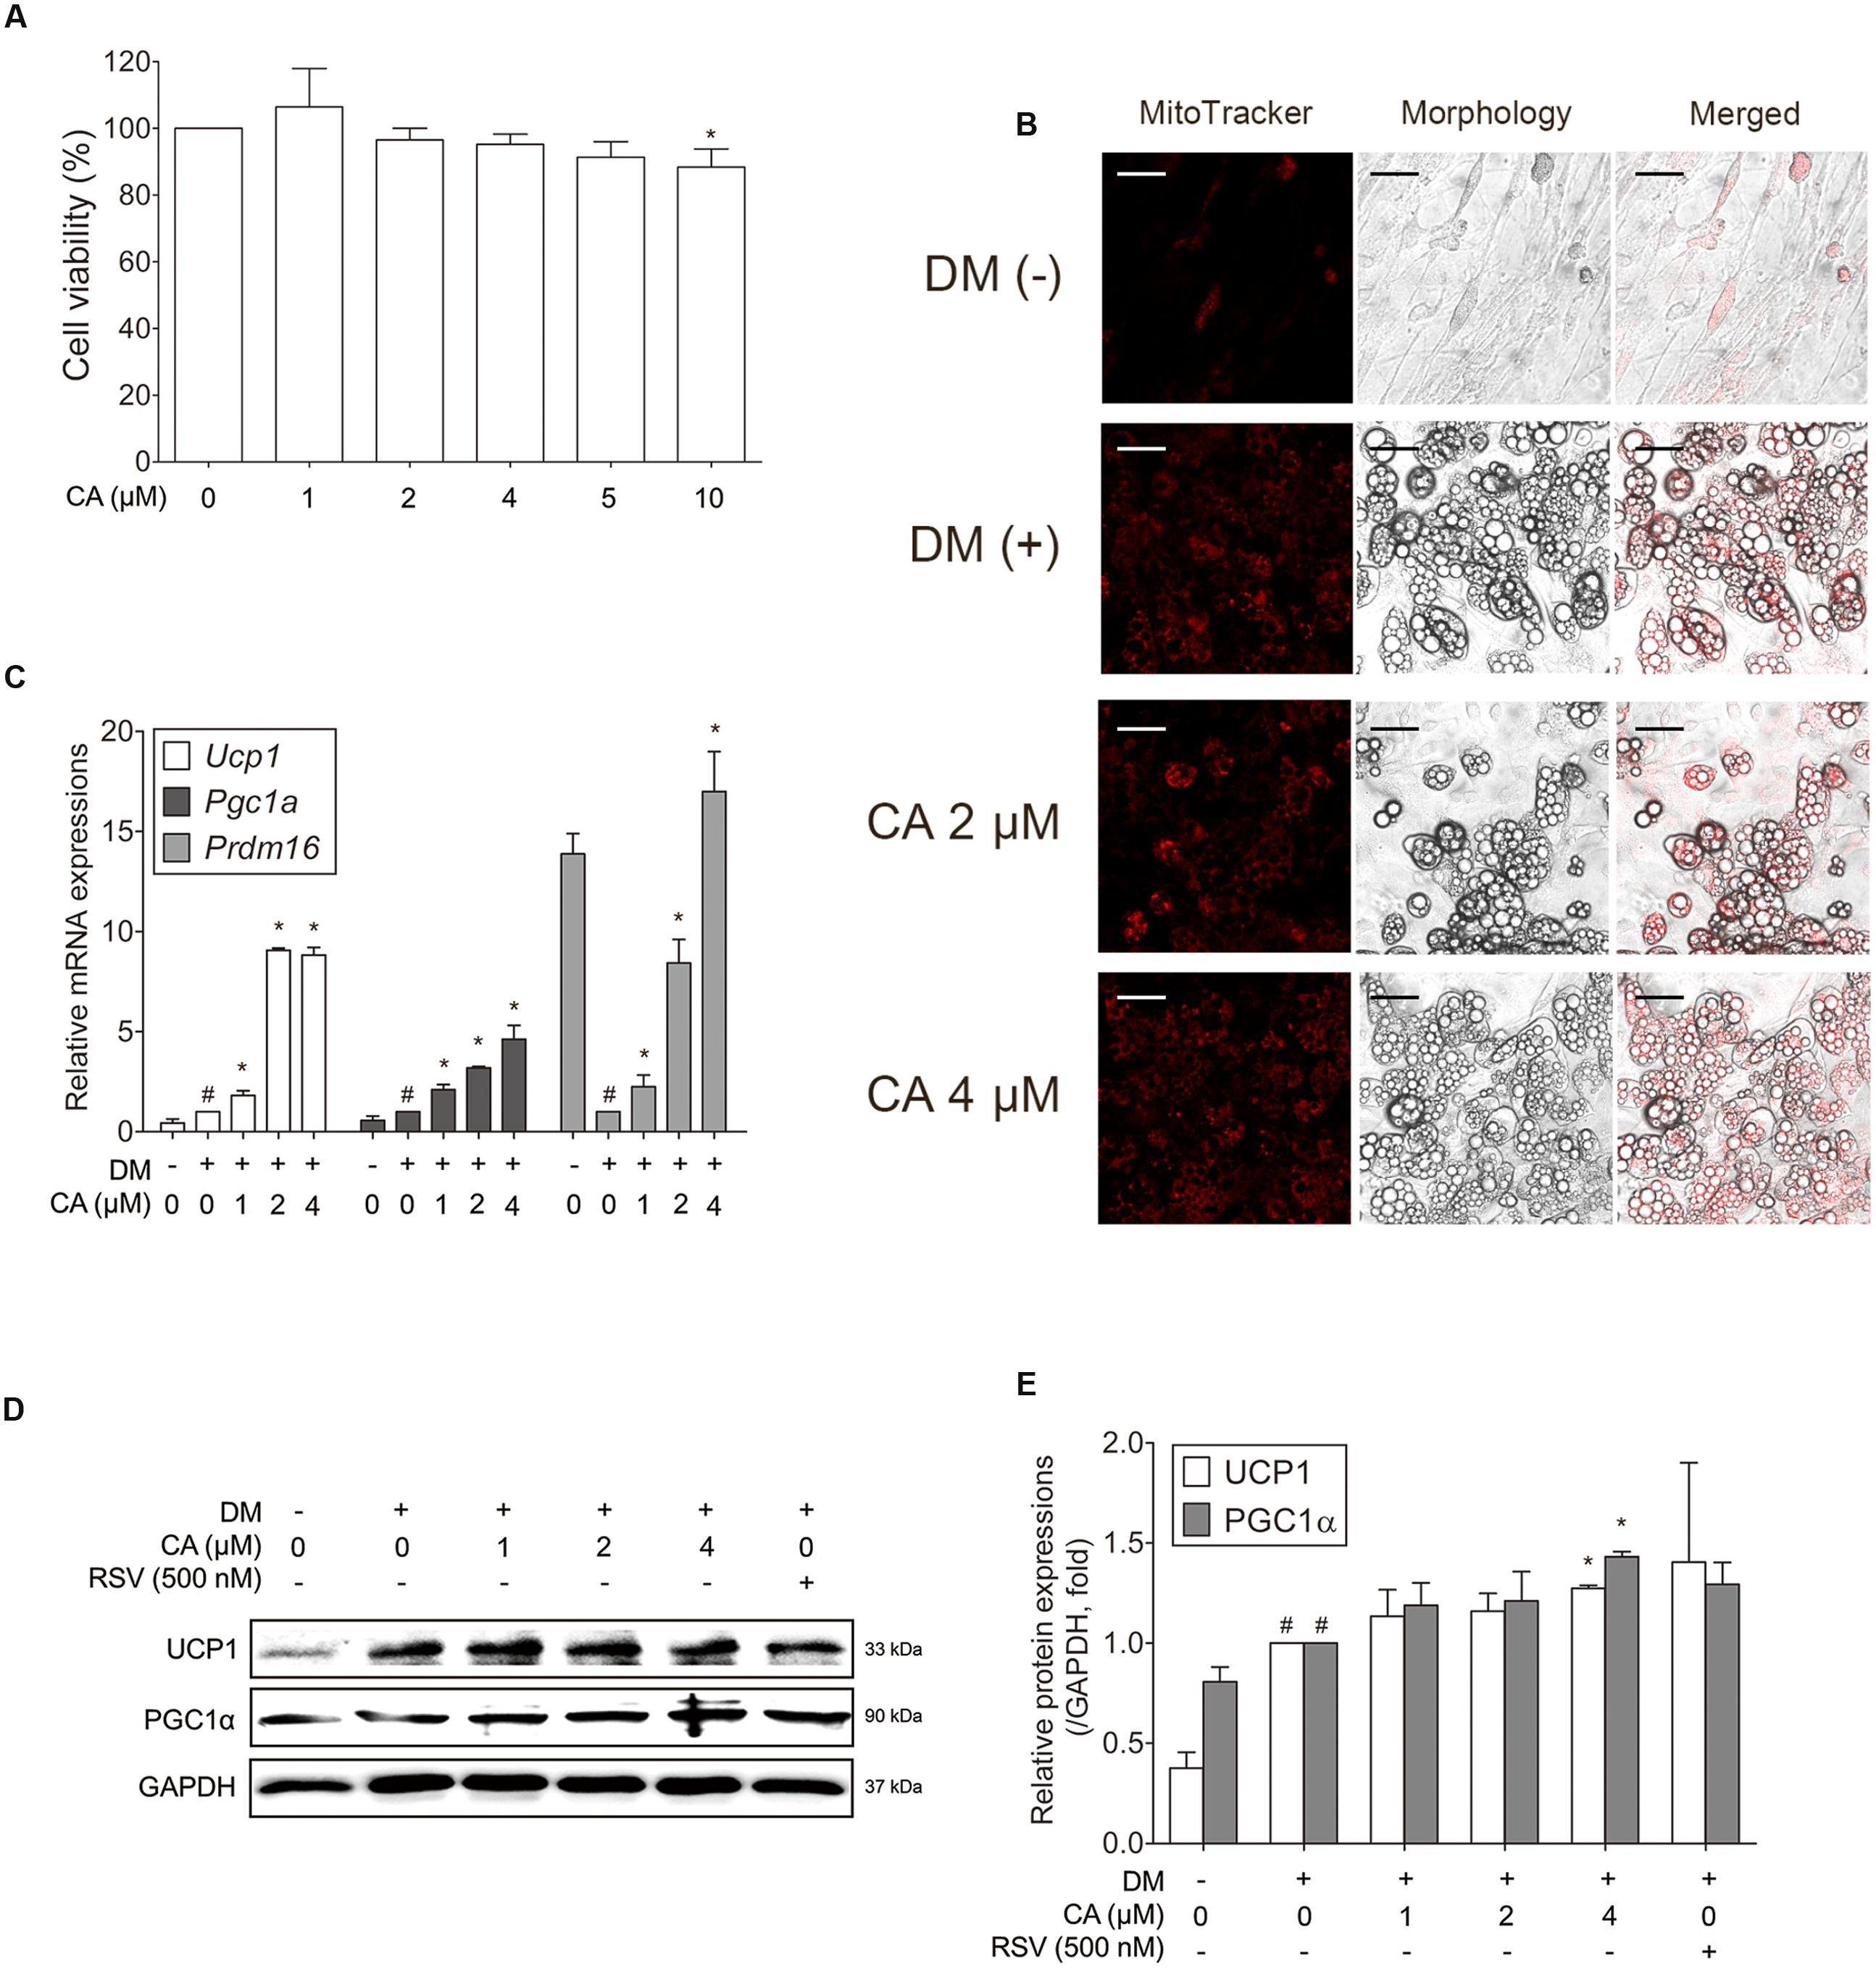
Fig. 6
Chrysophanic acid upregulates brown-fat-specific factors at both mRNA and protein levels in primary cultured brown adipocytes. (A) An MTS assay was performed to measure the survival rate of primary cultured brown adipocytes after treatment with CA. (B) Mitochondrial abundance in primary brown adipocytes was analyzed by MitoTracker Red staining (magnification 200×, scale bar 100 μm). (C) Real-time RT-PCR analyses of Ucp1, Pgc1a, and Prdm16 were performed. (D) Western blot analyses of UCP1 and PGC1α were performed. (E) Quantification of the protein bands was measured using ImageJ. RSV (500 nM) was used as a positive control. GAPDH was used as endogenous control. Data represent means ± SD of three independent experiments. #p < 0.05 compared with DM-uninduced preadipocytes, ∗p < 0.05 compared with DM-induced adipocytes. DM, differentiation medium.