
|
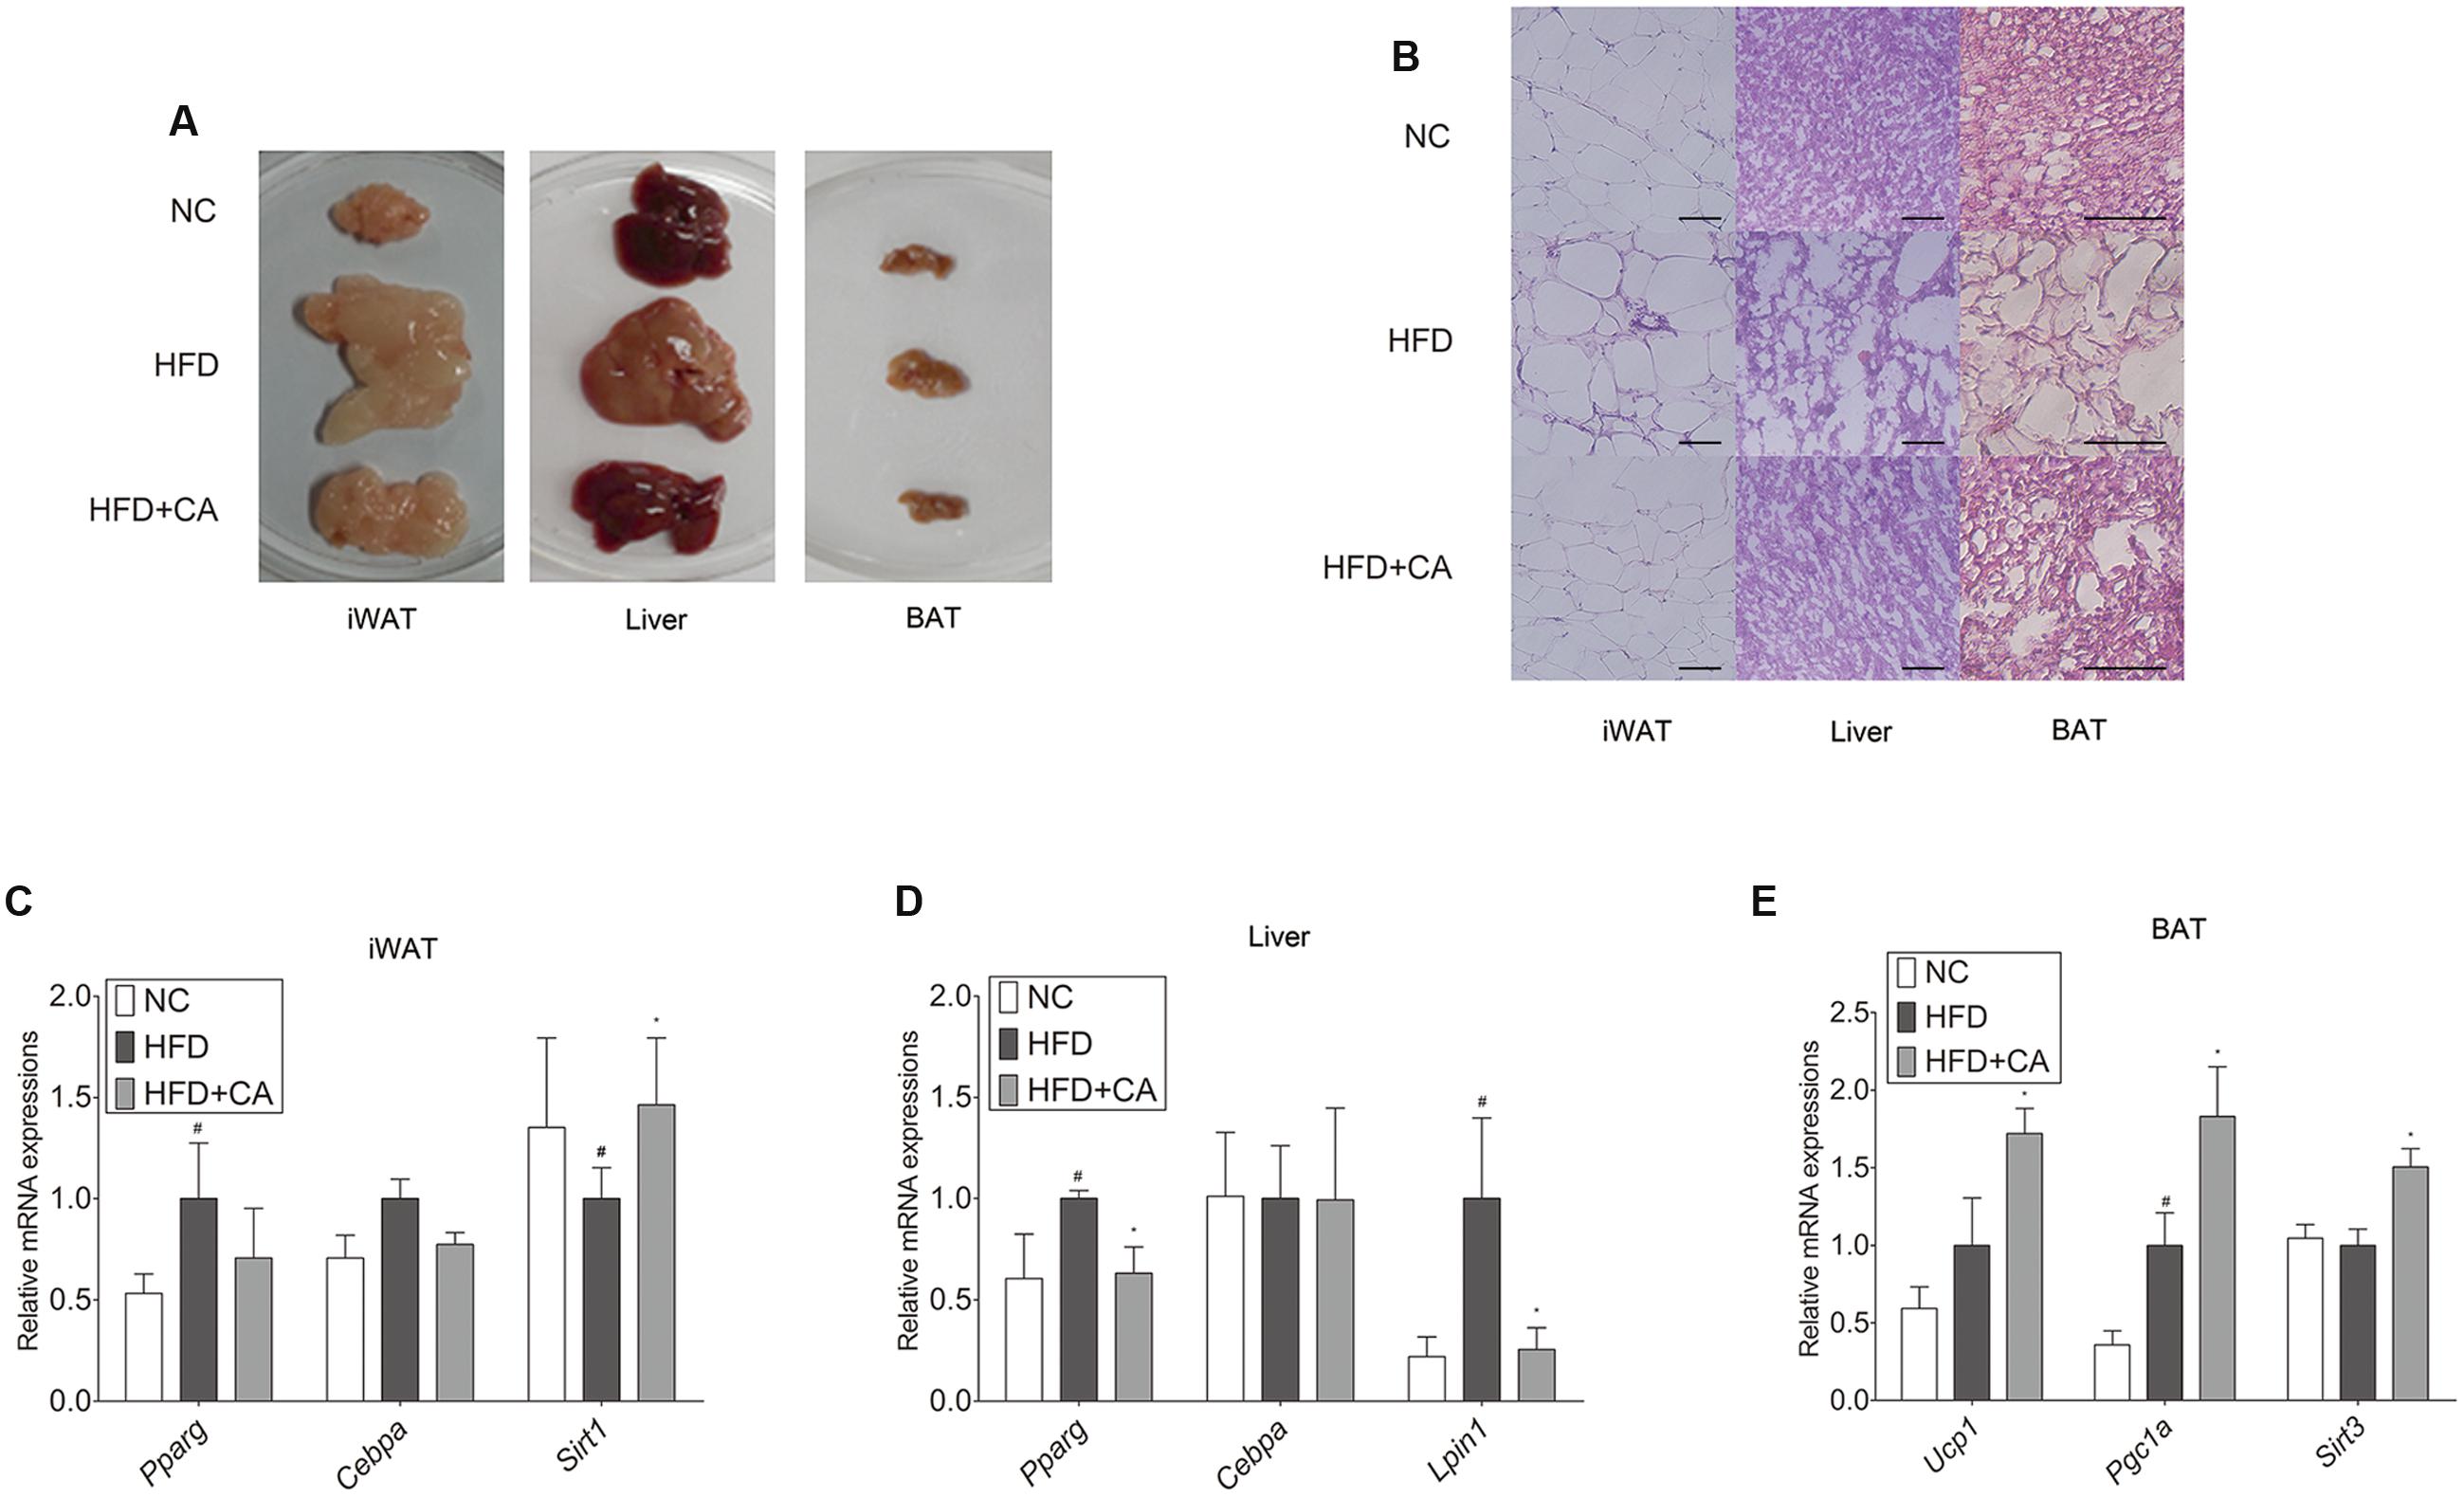
Fig. 2
Chrysophanic acid shows inhibitory effects on adipogenesis-related factors in tissues of C57BL/6J mice. (A) Visual comparisons and (B) H&E stainings of iWAT (magnification 200×, scale bar 100 μm), liver (magnification 200×, scale bar 100 μm), and BAT (magnification 400×, scale bar 100 μm) were performed. Real-time RT-PCR analyses of (C) Pparg, Cebpa, and Sirt1 in iWAT, (D) Pparg, Cebpa, and Lipin1 in liver, and (E) Ucp1, Pgc1a, and Sirt3 in BAT were performed. GAPDH was used as endogenous control. Data represent means ± SD of three independent experiments. #p < 0.05 compared with NC, ∗p < 0.05 compared with HFD. NC, normal control group; HFD, high-fat diet group; HFD + CA, high-fat diet plus CA group (n = 5 per group).