
Image
|
Figure Caption
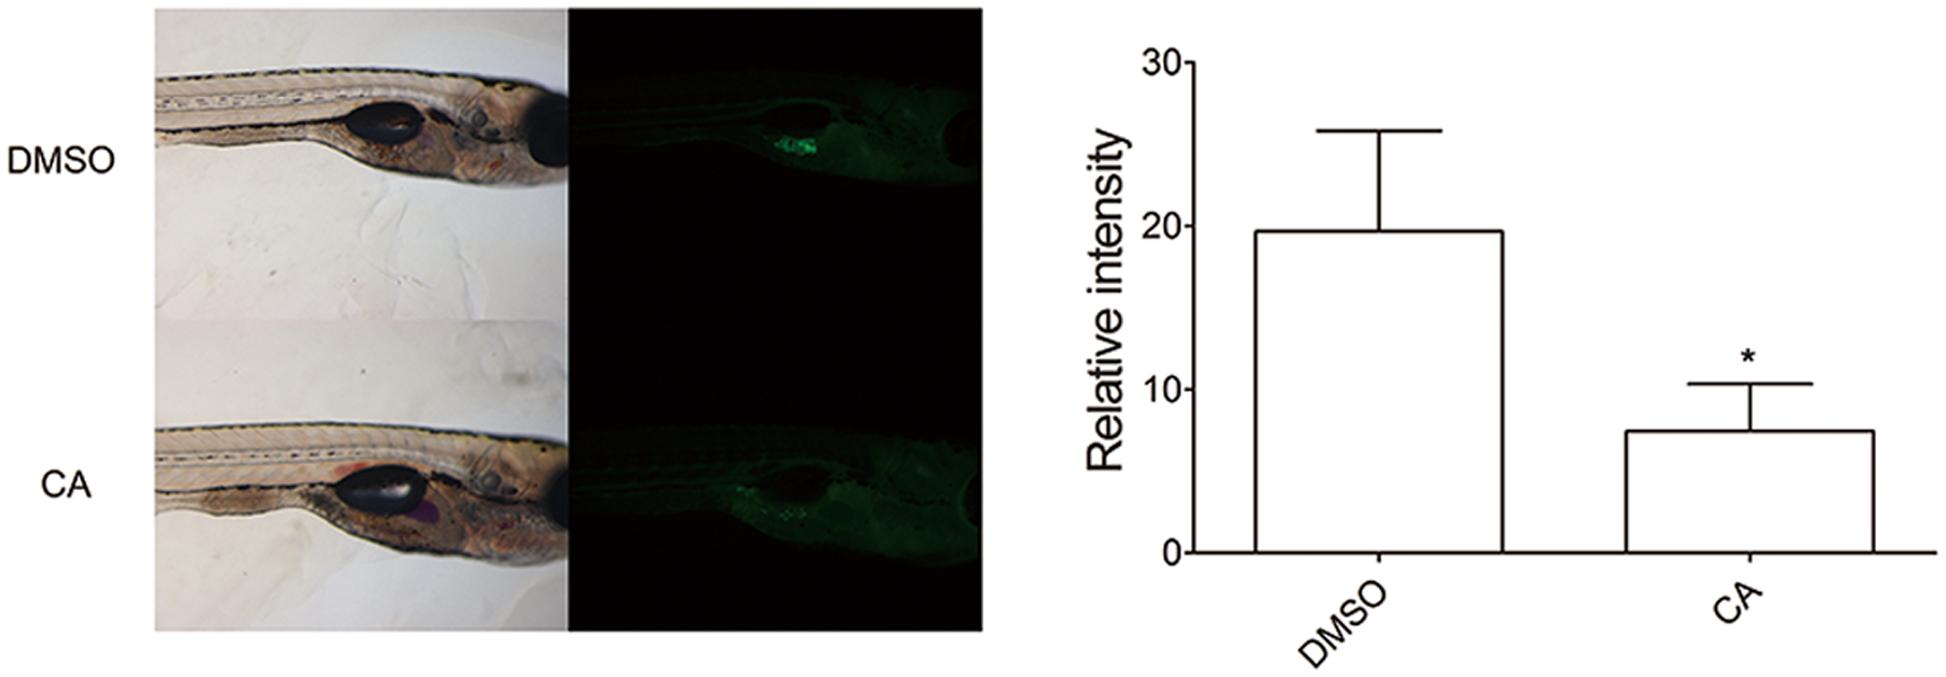
Fig. 3
Chrysophanic acid impairs adipocyte development in zebrafish. Zebrafish larvae treated with either DMSO (10 μM) or CA (10 μM) were shown in lateral views with anterior to the right. Both bright-field (Left) and fluorescent images (Right) were paired to visualize the location of adipocytes detected by Nile red. The quantification of the signal intensity from Nile red-positive adipocytes was measured by making multi-point selections of adipocytes using ImageJ. ∗p < 0.05 compared with DMSO-treated control. DMSO, DMSO-treated control group; CA, CA-treated group (n = 15 per group).
Figure Data
Acknowledgments
This image is the copyrighted work of the attributed author or publisher, and
ZFIN has permission only to display this image to its users.
Additional permissions should be obtained from the applicable author or publisher of the image.
Full text @ Front Pharmacol