
|
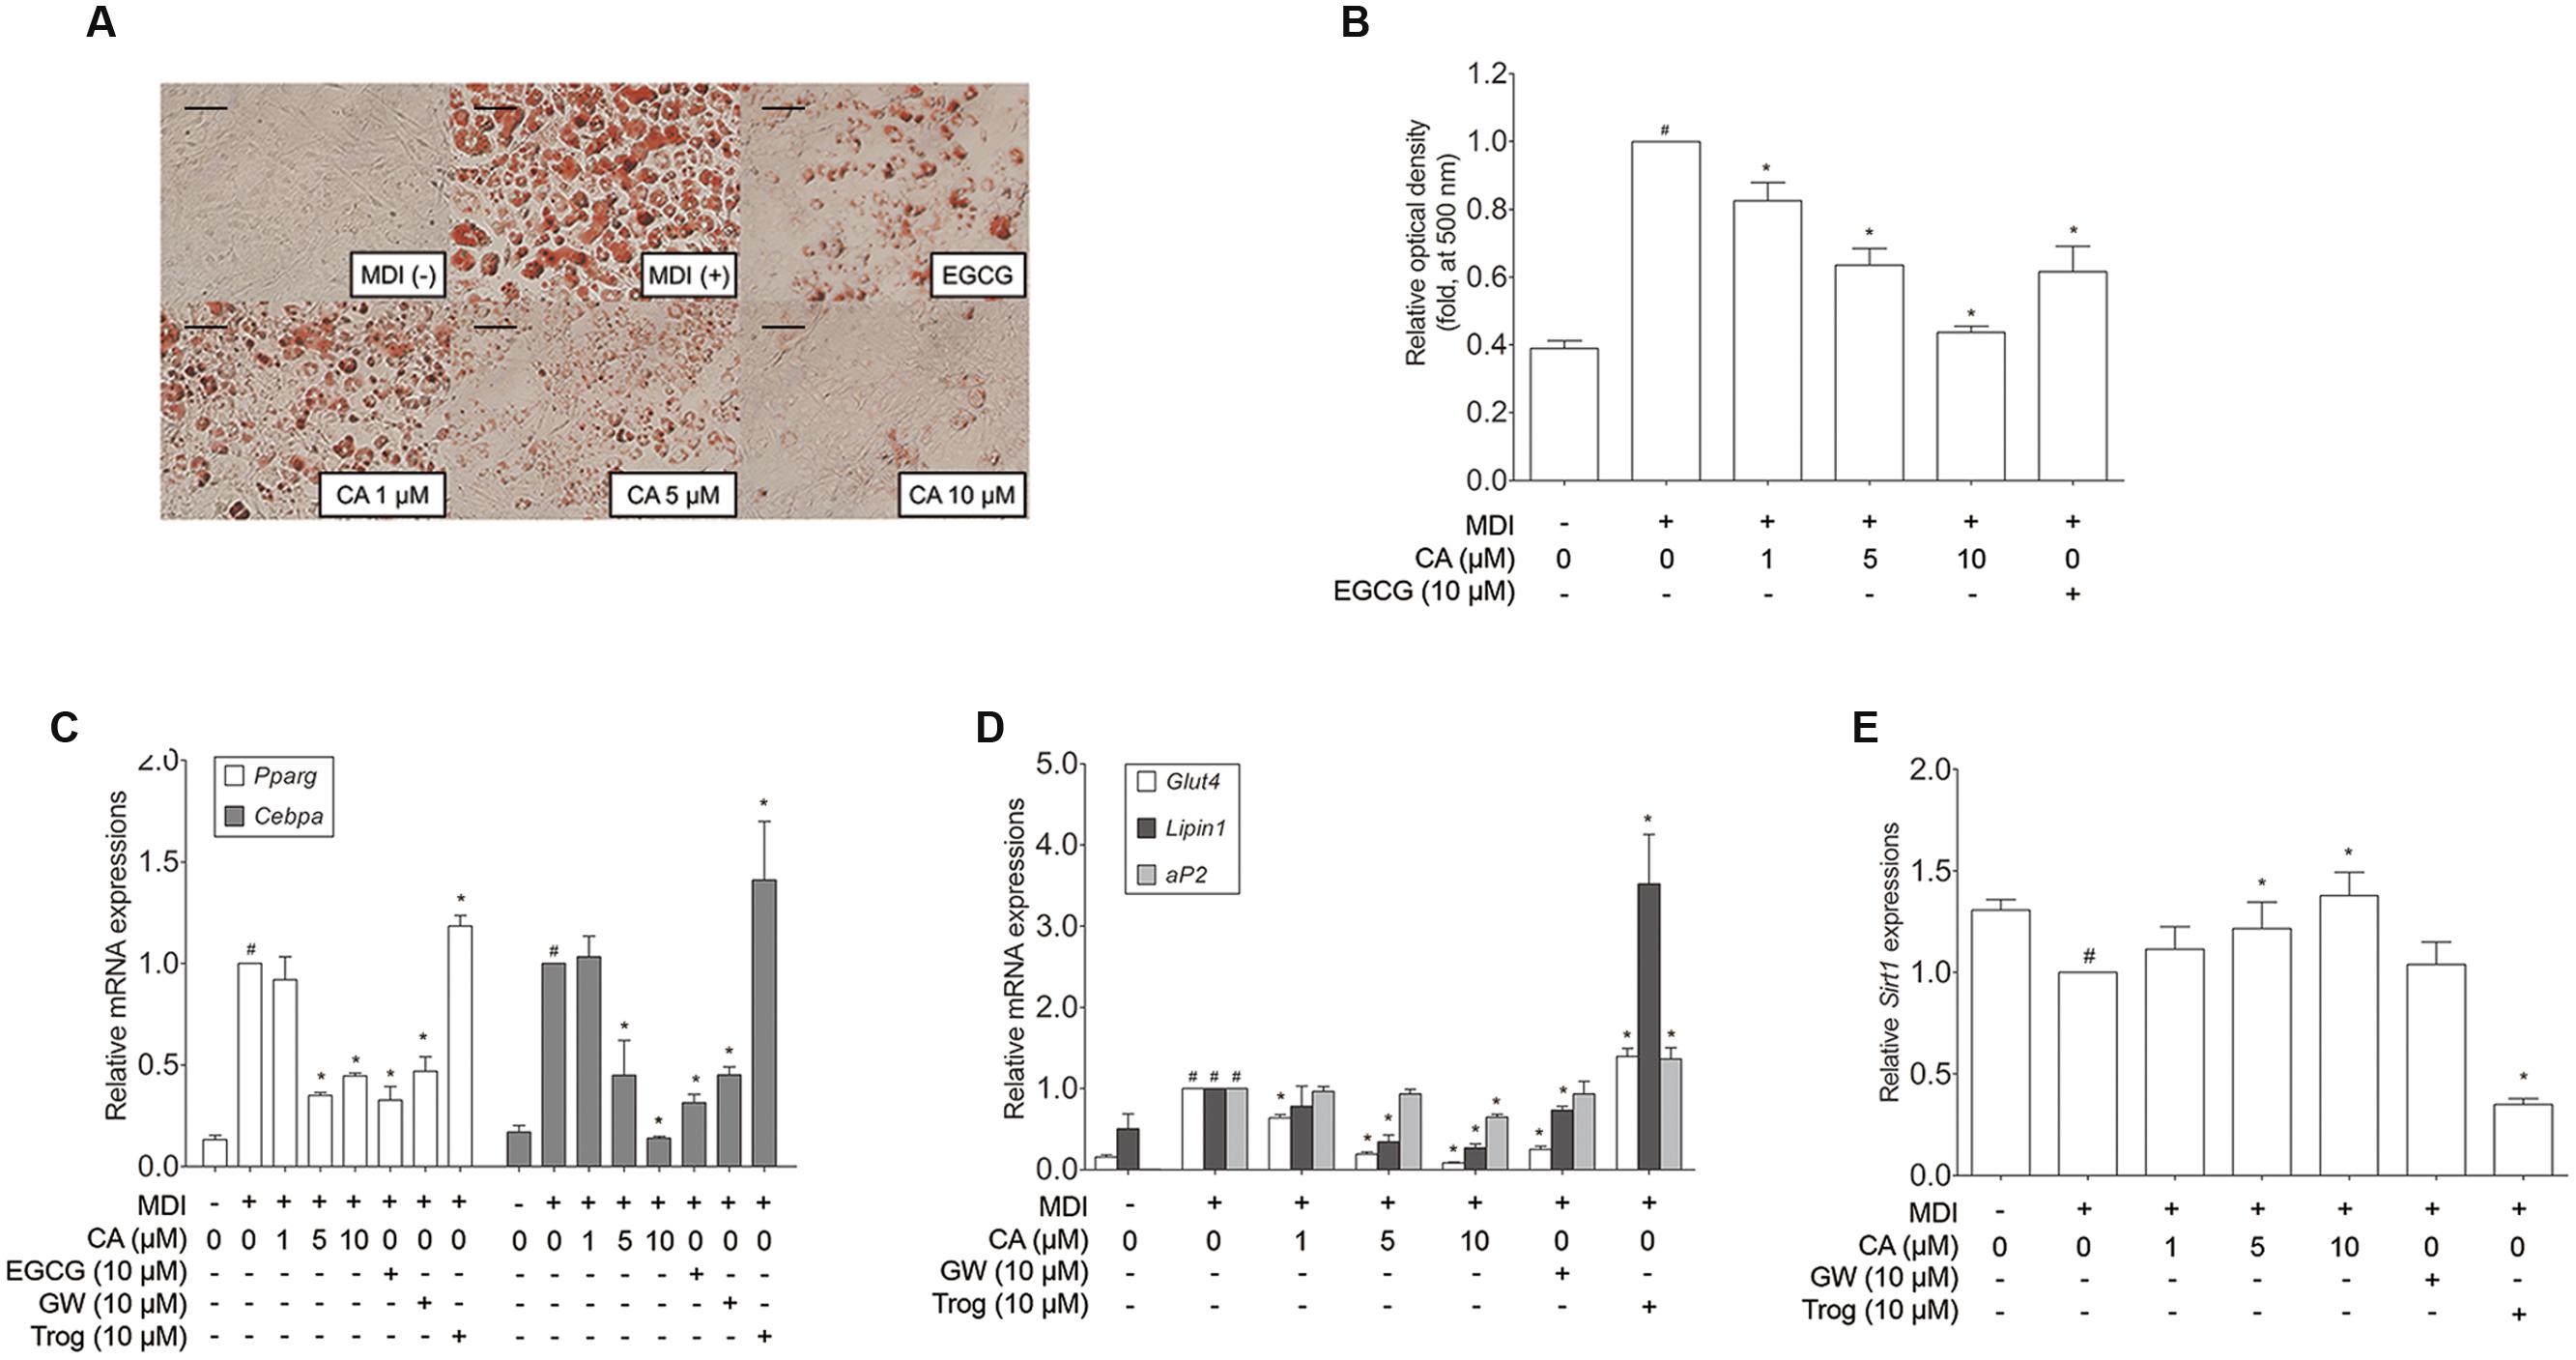
Fig. 4
Chrysophanic acid suppresses adipogenic factors in 3T3-L1 adipocytes. (A) An Oil Red O analysis was performed in order to measure the lipid accumulation (magnification 200×, scale bar 100 μm). (B) Relative optic density was measured at 500 nm. Real-time RT-PCR analyses of (C) Pparg, Cebpa, (D) Glut4, Lipin1, aP2, and (E) Sirt1 were performed. EGCG (10 μM) and GW (10 μM) were used as positive controls. Trog (10 μM) was used as a negative control. GAPDH was used as endogenous control. Data represent means ± SD of three independent experiments. #p < 0.05 compared with MDI-uninduced preadipocytes, ∗p < 0.05 compared with MDI-induced adipocytes. MDI, differentiation medium.