
- Title
-
Characterisation of sensitivity and orientation tuning for visually responsive ensembles in the zebrafish tectum
- Authors
- Thompson, A.W., Scott, E.K.
- Source
- Full text @ Sci. Rep.
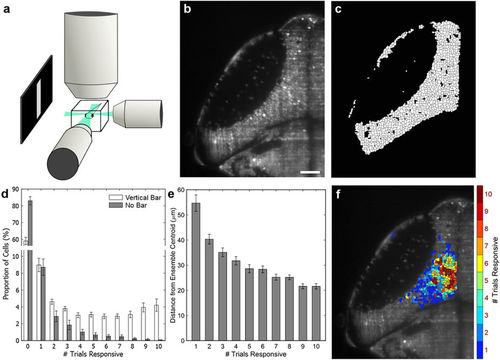
Identification of the most consistently responsive cells to a visual stimulus. (a) 6 dpf Elavl3:H2B-GCaMP6f larvae were presented with bright vertical bars moving caudal-to-rostral, and their contralateral tecta were imaged using SPIM with two orthogonal illumination planes. (b) Example image of nuclear GCaMP6f expression in the left tectum. Scale bar = 35 μm. (c) Automated segmentation of individual ROIs from the image in panel b. (d) When presented with a visual stimulus ten times, the number of trials during which cells were active increased relative to animals presented with no stimulus (spontaneous activity) (p = 8.00 × 10⁻⁵ versus slope = 0, linear regression, n = 18 fish, 801 ± 19.6 cells per fish, error bars = SEM). (e) Cells that were more consistently responsive were, on average, located closer to the ensemble centroid. (f) The spatial distribution of cells with different response consistencies to the visual stimulus, from a single representative larva. Highly reliable cells are located near the centre of the cluster, and the consistency of these responses gradually declines toward the edges. |
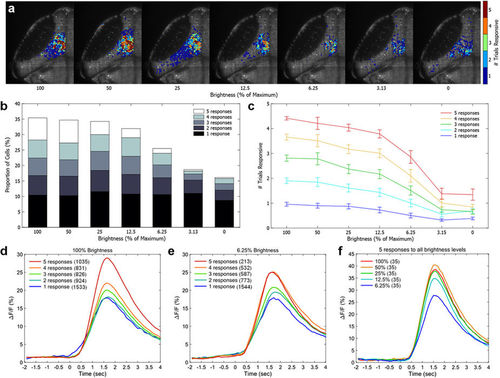
Consistently-responsive cells remain more responsive than other cells as stimulus intensity is reduced. (a) Example distribution of tectal cells responding to a moving vertical bar of decreasing brightness levels, drawn from a single representative larva. Cells more reliably responsive to bright bars were also more likely to be responsive to faint bars. (b) The proportion of total cells active in any trial, including the proportion of consistently-responding cells, decreased as stimulus brightness was decreased to 0 (no stimulus). (c) Cells responsive at different initial rates (taken from a separate set of five trials at 100% brightness, legend in c) decreased the number of trials to which they were responsive as stimulus brightness was decreased. (d) Reliably responding cells at 100% brightness had stronger ΔF/F responses than those responding less consistently to the same stimulus. (e) This pattern was maintained at 6.25% brightness, albeit with fewer cells, and responses were of a similar strength to those in the 100% brightness condition. (f) Cells that responded to all trials at all intensities from 100% to 6.25% showed a decrease in response strength when responding to fainter stimuli. In d–f, the number of cells in each category is indicated in parentheses. |
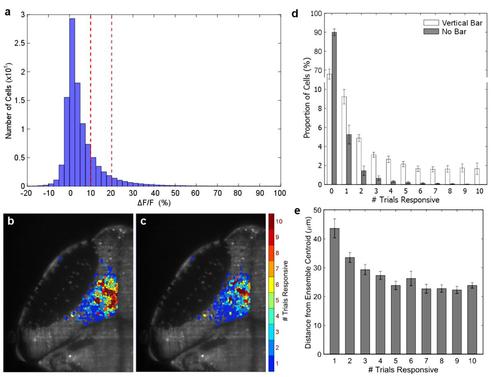
Relative distribution of response frequencies within ensembles are unchanged using more stringent response thresholds. (a) Histogram of response magnitudes for all cells across all trials responding to moving bar stimuli. The cutoff threshold for response used in this study was 10% ΔF/F (left dotted line). A more stringent threshold for response (20% ΔF/F, right dotted line) removed many small magnitude responses but did not alter the underlying descriptions of ensemble structure (see below). (b) The spatial distribution of cells with different response consistencies to the visual stimulus, from a single representative larva (as shown in Fig. 1f). (c) Based on a more stringent 20% ΔF/F response threshold, the spatial distribution of response consistencies was largely unchanged compared to the same cells in panel b, although fewer responses were registered because of the more stringent cutoff. (d) Using a 20% ΔF/F response threshold, the number of trials during which cells were active relative to no stimulus control shows the same divergence as in Fig. 1d, although the absolute number of cells was reduced. (e) With the more stringent 20% ΔF/F response threshold, cells with different response consistencies were located, on average, similar distances from the ensemble centroid as with the original threshold used in Fig. 1e. |
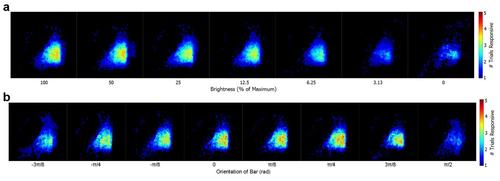
Consistency of response frequencies within ensembles across multiple fish. (a) Average distribution of visually-responsive neurons to presentations of moving vertical bar stimulus of decreasing brightness intensities from 18 experimental animals. Responsive cells within each fish were centered by their weighted centroid and overlaid across an average tectal template. (b) Average distribution of visually-responsive neurons to presentations of moving vertical bar stimulus of decreasing brightness intensities from 9 experimental animals. Responses were overlaid as for panel a. |