
Fig. 1
- ID
- ZDB-FIG-171127-20
- Publication
- Thompson et al., 2016 - Characterisation of sensitivity and orientation tuning for visually responsive ensembles in the zebrafish tectum
- Other Figures
- All Figure Page
- Back to All Figure Page
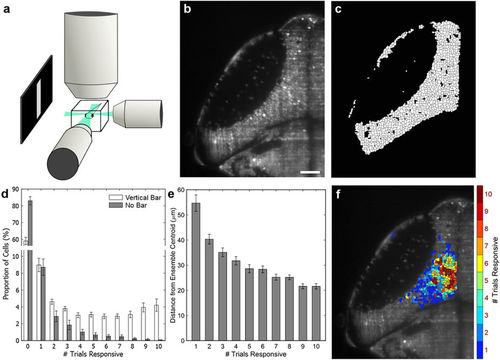
Identification of the most consistently responsive cells to a visual stimulus. (a) 6 dpf Elavl3:H2B-GCaMP6f larvae were presented with bright vertical bars moving caudal-to-rostral, and their contralateral tecta were imaged using SPIM with two orthogonal illumination planes. (b) Example image of nuclear GCaMP6f expression in the left tectum. Scale bar = 35 μm. (c) Automated segmentation of individual ROIs from the image in panel b. (d) When presented with a visual stimulus ten times, the number of trials during which cells were active increased relative to animals presented with no stimulus (spontaneous activity) (p = 8.00 × 10⁻⁵ versus slope = 0, linear regression, n = 18 fish, 801 ± 19.6 cells per fish, error bars = SEM). (e) Cells that were more consistently responsive were, on average, located closer to the ensemble centroid. (f) The spatial distribution of cells with different response consistencies to the visual stimulus, from a single representative larva. Highly reliable cells are located near the centre of the cluster, and the consistency of these responses gradually declines toward the edges. |