
FIGURE
Fig. S2
- ID
- ZDB-FIG-171127-23
- Publication
- Thompson et al., 2016 - Characterisation of sensitivity and orientation tuning for visually responsive ensembles in the zebrafish tectum
- Other Figures
- All Figure Page
- Back to All Figure Page
Fig. S2
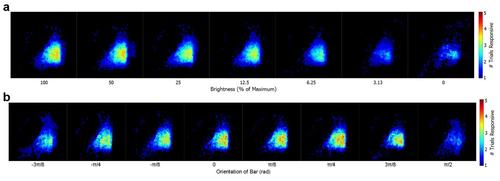
Consistency of response frequencies within ensembles across multiple fish. (a) Average distribution of visually-responsive neurons to presentations of moving vertical bar stimulus of decreasing brightness intensities from 18 experimental animals. Responsive cells within each fish were centered by their weighted centroid and overlaid across an average tectal template. (b) Average distribution of visually-responsive neurons to presentations of moving vertical bar stimulus of decreasing brightness intensities from 9 experimental animals. Responses were overlaid as for panel a. |
Expression Data
Expression Detail
Antibody Labeling
Phenotype Data
Phenotype Detail
Acknowledgments
This image is the copyrighted work of the attributed author or publisher, and
ZFIN has permission only to display this image to its users.
Additional permissions should be obtained from the applicable author or publisher of the image.
Full text @ Sci. Rep.