
|
Fig. S1
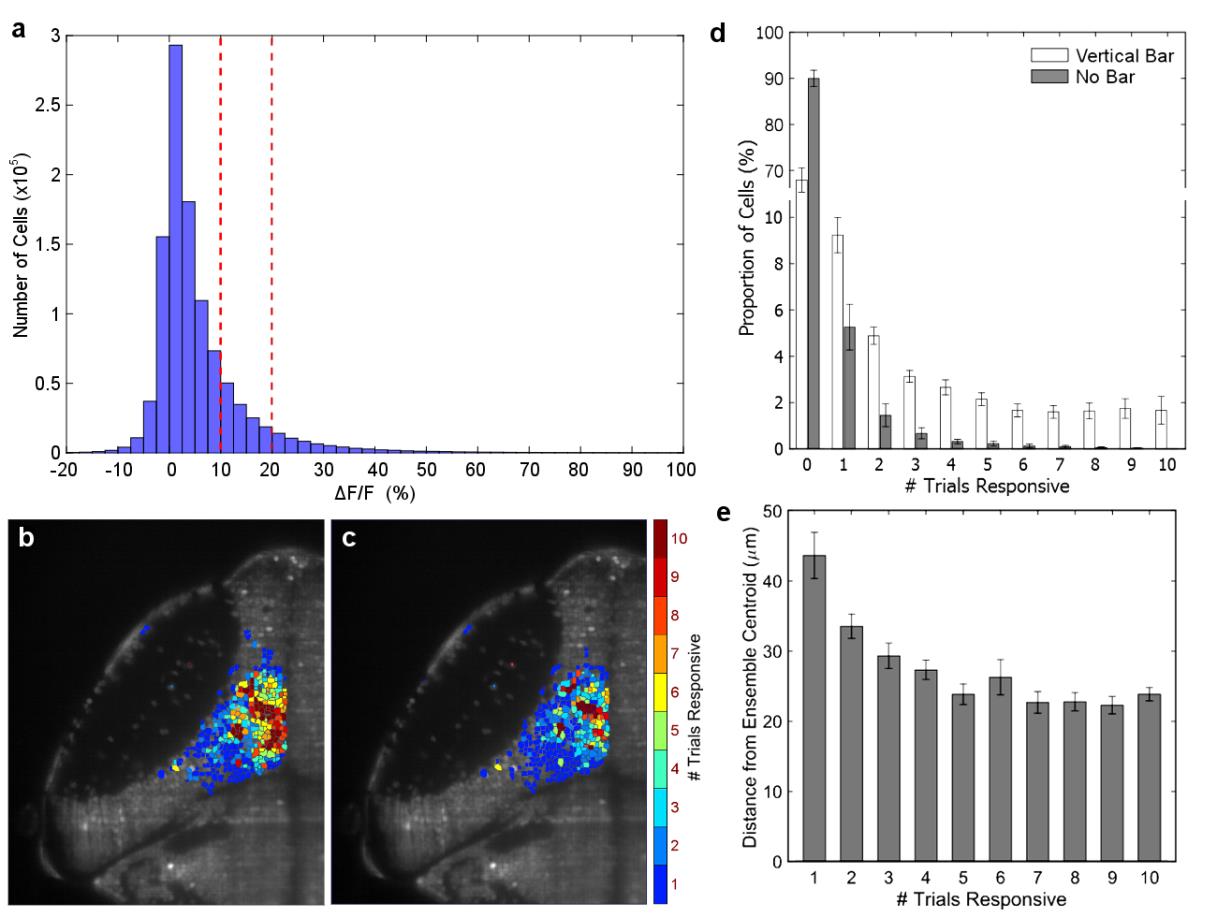
Relative distribution of response frequencies within ensembles are unchanged using more stringent response thresholds.
(a) Histogram of response magnitudes for all cells across all trials responding to moving bar stimuli. The cutoff threshold for response used in this study was 10% ΔF/F (left dotted line). A more stringent threshold for response (20% ΔF/F, right dotted line) removed many small magnitude responses but did not alter the underlying descriptions of ensemble structure (see below). (b) The spatial distribution of cells with different response consistencies to the visual stimulus, from a single representative larva (as shown in Fig. 1f). (c) Based on a more stringent 20% ΔF/F response threshold, the spatial distribution of response consistencies was largely unchanged compared to the same cells in panel b, although fewer responses were registered because of the more stringent cutoff. (d) Using a 20% ΔF/F response threshold, the number of trials during which cells were active relative to no stimulus control shows the same divergence as in Fig. 1d, although the absolute number of cells was reduced. (e) With the more stringent 20% ΔF/F response threshold, cells with different response consistencies were located, on average, similar distances from the ensemble centroid as with the original threshold used in Fig. 1e.