
|
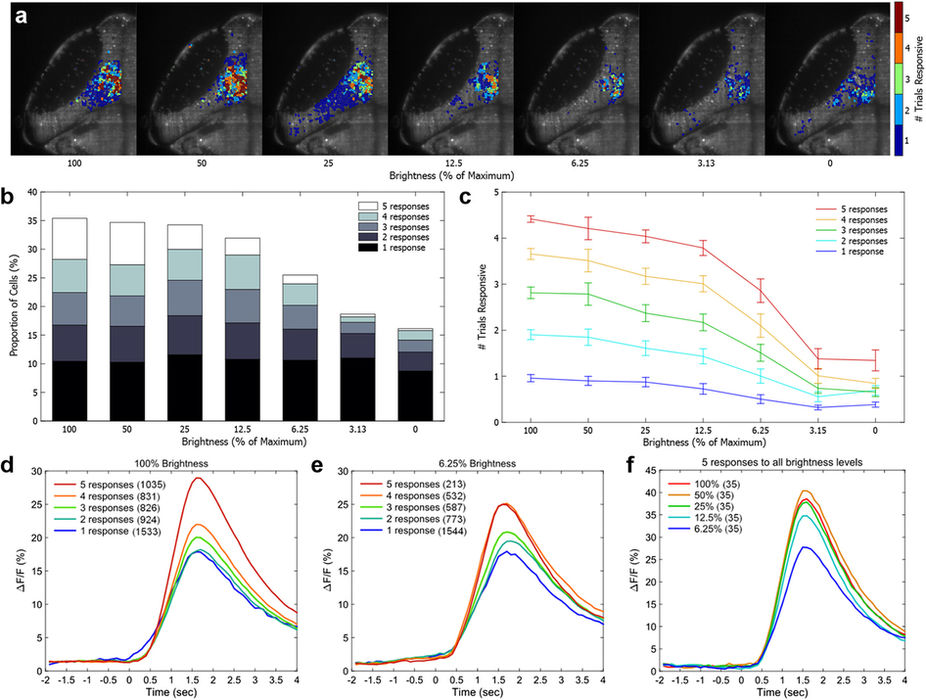
Fig. 2
Consistently-responsive cells remain more responsive than other cells as stimulus intensity is reduced.
(a) Example distribution of tectal cells responding to a moving vertical bar of decreasing brightness levels, drawn from a single representative larva. Cells more reliably responsive to bright bars were also more likely to be responsive to faint bars. (b) The proportion of total cells active in any trial, including the proportion of consistently-responding cells, decreased as stimulus brightness was decreased to 0 (no stimulus). (c) Cells responsive at different initial rates (taken from a separate set of five trials at 100% brightness, legend in c) decreased the number of trials to which they were responsive as stimulus brightness was decreased. (d) Reliably responding cells at 100% brightness had stronger ΔF/F responses than those responding less consistently to the same stimulus. (e) This pattern was maintained at 6.25% brightness, albeit with fewer cells, and responses were of a similar strength to those in the 100% brightness condition. (f) Cells that responded to all trials at all intensities from 100% to 6.25% showed a decrease in response strength when responding to fainter stimuli. In d–f, the number of cells in each category is indicated in parentheses.