
- Title
-
Additive reductions in zebrafish PRPS1 activity result in a spectrum of deficiencies modeling several human PRPS1-associated diseases
- Authors
- Pei, W., Xu, L., Varshney, G.K., Carrington, B., Bishop, K., Jones, M., Huang, S.C., Idol, J., Pretorius, P.R., Beirl, A., Schimmenti, L.A., Kindt, K.S., Sood, R., Burgess, S.M.
- Source
- Full text @ Sci. Rep.
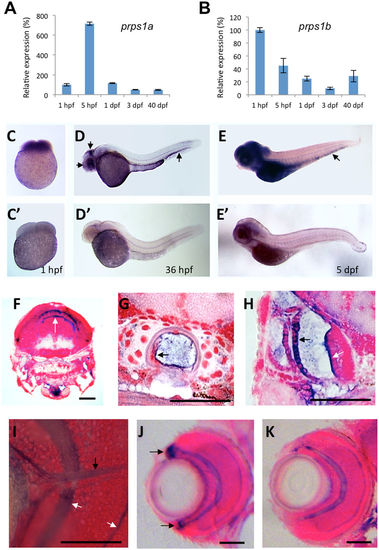
prps1a and prps1b expression in early zebrafish development. (A,B) qRT-PCR analysis of prps1a (A) and prps1b (B) expression at five developmental stages. 20 embryos at stages 1 hpf, 5 hpf, 1 dpf, 3 dpf, or 3 juvenile fish at 40 dpf were pooled together for total RNA extraction, and then qRT-PCR analysis. The internal reference used for qPCR is β–actin, whose expression may vary from maternal to zygotic stages but suffices to compare temporal expression differences between genes. Graphs show the mean and standard deviation, with the relative expression level at each timepoint normalized to 1 hpf (100%). (C–E) Whole mount in situ hybridization analysis of prps1a expression at the 1 hpf (C), 36 hpf (D), and 5 dpf (E). 15 embryos per group were used for in situ hybridization analysis. Representative images are shown for the antisense (C–E) and sense probes (C'–E'). Three arrows in D point to the enrichment in the eye, tectum and hematopoetic tissue. Images in (E,E') are from an extended staining to show the expression in the hematopoietic tissue (arrow in E). (F–I) Histological sections reveal prps1a expression in the brain (F), notochord (G), inner ear (H), and optic nerve (I). prps1a and prps1b expression was very similar, therefore representative prps1a images are shown. White arrow in F points to the enrichment in two stripes in the dorsal brain. Black arrow in G points to the enrichment in cells of the notochord. Black arrow and white arrow in H point to in the outer otic vesicle epithelium and the sensory epithelium of cristae of the inner ear, respectively. White arrows in I point to the retinal inner and outer plexiform layers, and the black arrow in I points to the optic nerve, all of which show relatively elevated levels of prps1a expression. (J,K) Histological sections reveal enriched prps1a expression in the retinal cilliary marginal zone, black arrows in J points to the expression of prps1a in ciliary marginal zone (J), but prps1b is not expressed in the CMZ (K). Images in (F–K) were obtained from in situ stained 5-day old embryos that were transversely sectioned and then counterstained with nuclear fast red. Scale bars in (F–K), 50 μm. EXPRESSION / LABELING:
|

ZFIN is incorporating published figure images and captions as part of an ongoing project. Figures from some publications have not yet been curated, or are not available for display because of copyright restrictions. EXPRESSION / LABELING:
PHENOTYPE:
|
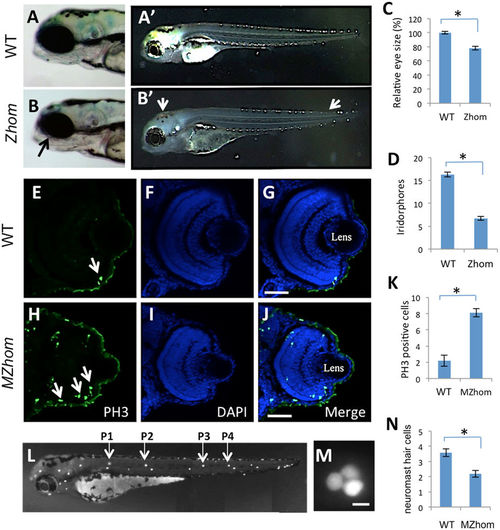
The prps1a mutation causes a reduction in the eye, a loss of iridophores, and a reduction in neuromast hair cells. (A,B) Eye phenotype in the control (A) and prps1a Zhom (B) embryos at 3 dpf. Black arrow in B points to the slightly smaller eye in the Zhom mutant. (A',B') Iridophore phenotype in control (A') and prps1a Zhom (B') embryos at 3 dpf. White arrows in B' point to the areas where iridophores are reduced in different tissues. (C,D) Quantification of the reduction in eye size (C) and iridophores (D). Eye area was calculated by image J. The numbers of iridophores were obtained by counting the iridophores in the dorsal and ventral side of the trunk area above the yolk extension. The reduction was significant in the eye size (n = 8, p < 0.001) and iridophores (n = 12, p < 0.001). (E–J) Immunohistochemical staining of phosphorylated histone H3 Ser10 in the control and MZhom embryos at 3 dpf. Columns from left to right show the representative images from the staining of phosphorylated histone H3 Ser10, DAPI, and the merged image. White arrows in H point to representative positive cells. (K) Quantification of phosphorylated histone H3 cells in the retina. The increased number of H3 Ser10 positive cells in the MZhom embryos is significant (n = 5 for Ctrl, n = 7 for MZhom, p < 0.001). (L–M) Fluorescent images of a wild-type Yopro-1 stained embryo at 3 dpf showing the location of neuromasts (L) and a higher magnification of the P1 neuromast (M). Hair cells in P1–P4 neuromasts were counted for prps1a mutants and control siblings. (N) prps1a homozygous mutants have a reduced number of neuromast hair cells at 3 dpf. The reduction is significant (n = 10, p < 0.001). Scale bars: 50 μm in (G,J); 10 μm in (M). PHENOTYPE:
|
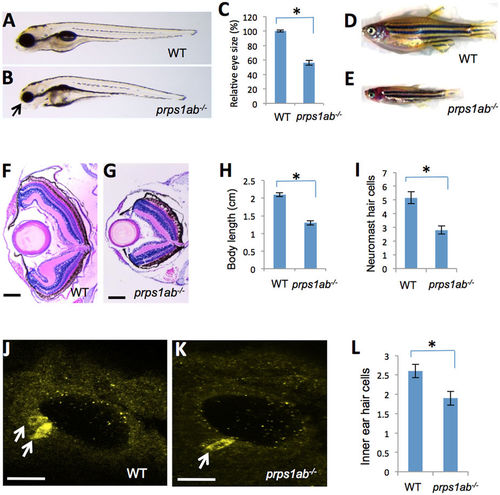
prps1a;prps1b double mutant displays defects in the eye, craniofacial structure, general growth, neuromast and inner ear hair cells. (A,B) Eye phenotype of the double mutant. Images show genetically-related wild-type (A) and the double mutant (B) at 5 dpf. Arrow in B points to the small eye and abnormal craniofacial structure of the double mutant. Most double mutants fail to inflate the swim bladder. (C) Quantification of the reduction in the eye size. Eye area is calculated using Image J. The reduction is significant (n = 9, p < 0.001). (D,E) Morphology of wild-type (D) and the double mutant fish (E) at 35 dpf, only 5% of the double mutant fish survive to this age. (F,G) Retinal lamination of wild-type (F) and the double mutant (G) at 35 dpf. The double mutant had a poorly formed retinal inner plexiform layer and has an under-developed retinal pigment epithelial layer. (H) Quantification of the body length at 35 dpf. The reduction in the double mutant is significant (n = 6, p < 0.001). (I) Quantification of the neuromast hair cells in the double mutants at 3 dpf. The reduction in the double mutant is significant (n = 9 for wild-type, n = 11 for the double mutant, p < 0.001). (J,K) Inner ear hair cells in the embryos at 32 hpf were stained with a mixture of myosin-VIIa and hair cell soma-1 antibodies. 14 embryos per group were used for inner ear hair cell analysis. Representative images are shown. White arrows indicate positive staining of hair cells. (L) Quantification of the reduction of inner ear hair cells. The reduction in the double mutants is significant (n = 14, p = 0.003). For all graphs, the average and s.e.m are shown. prps1ab−/− indicates the prps1a:prps1b double mutants. Scale bars: 200 μm in (F,G); 50 μm in (J,K). PHENOTYPE:
|
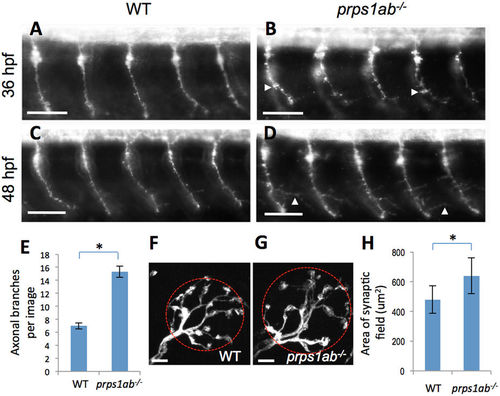
prps1a:prps1b double mutants display abnormal morphology in primary motor neuron and neuromast hair cell innervation. (A–D) Primary motor neurons stained using the znp-1 antibody. (A,B) Morphology of motor neuron axons in wild-type (A) and double mutant (B) embryos at 36 hpf. White arrowheads point to aberrant pseudopodia. The axons in the double mutants were shorter with increased branching compared to wild-type siblings. (C,D) Morphology of motor neuron axons in wild-type (C) and double mutant (D) embryos at 48 hpf. White arrowheads point to elongated branches. 10 embryos are used for each group of staining, with one representative image shown. (E) Quantification of axon branching. Y-axis indicates the number of elongated branches per image that frames 5 neurons. The increase in axon branching is significant in the double mutant (n = 10, p < 0.001). (F–H) Afferent neurons innervating neuromast hair cells stained with a calretinin antibody. (F,G) Morphology of innervating afferent neurons and fibers in wild-type (F) and double mutant (G) at 6 dpf, red circles are examples of the area calculated. (H) Quantification of the innervating areas. The analysis was done with 12 neuromasts from 9 wild-type embryos and 13 neuromasts from 6 double mutants. The area each neuron innervates is significantly greater in the double mutants. The difference between wild-type and double mutant is significant (Tukey's multiple comparisons, p < 0.01). Scale bars: 50 μm in (A–D); 5 μm in (F,G). |
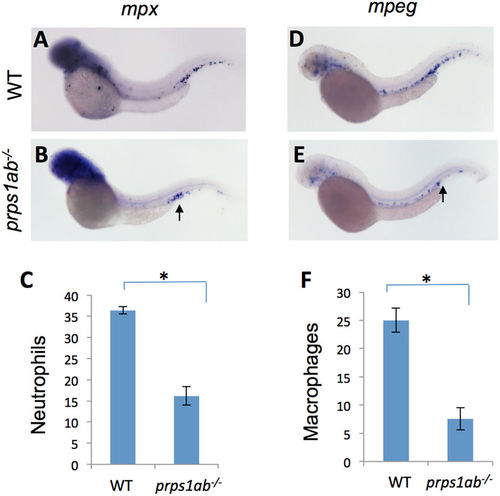
prps1a:prps1b double mutants had a reduced number of leukocytes. (A–C) Double mutant fish had a reduced number of neutrophils. The genetically-related wild-type (A) and double mutant (B) embryos at 2 dpf were probed for mpx (neurtrophil) mRNA expression. Representative lateral view images of embryos are shown. Qualification of the data is shown in (C). prps1ab−/− indicates prps1a:prps1b double mutant. (D–F) Double mutants have a reduced number of macrophages. Wild-type (D) and double mutant (E) embryos at 2 dpf are probed for mpeg mRNA expression (macrophages). Representative images are shown. Quantification data are shown in (F). For the quantification, leukocytes in the caudal hematopoietic tissue are counted. Graphs show the average numbers of neutrophils or macrophages per embryo. Error bars show the s.e.m. The double mutants show a significant reduction of both neutrophils and macrophage (n = 10, p < 0.001 for both). |
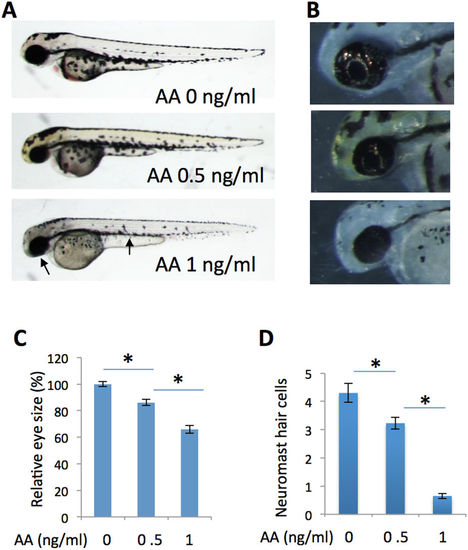
Inhibition of energy ATP production by antimycin A partially phenocopies the prps1a;prps1b mutant phenotypes. (A) Antimycin A treatment of wild-type embryos produces a dose-dependent reduction in melanocytes and eye size. Antimycin A concentrations are indicated. Arrows point to small eye and melanocyte reduction in the embryo treated with 1 ng/ml of antimycin A. (B) Dose-dependent reduction of retinal iridophores in the treated embryos. (C) Quantification of eye size reduction. Eye size is measured by Image J. A significant reduction is detected between antimycin A at 0 ng/ml and 0.5 ng/ml (t-test, p < 0.001), and between antimycin A at 0.5 ng/ml and 1 ng/ml (t-test, p = 0.019). (D) Dose-dependent reduction of neuromast hair cells in antimycin A-treated embryos. A significant reduction is detected between antimycin A at 0 ng/ml and 0.5 ng/ml (t-test, p = 0.008), and between antimycin A at 0.5 ng/ml and 1 ng/ml (t-test, p < 0.001). Eye area and neuromast hair cell analysis were performed with 10 embryos for each group. Graphs show the mean and s.e.m. Replication of the experiment produced similar results. PHENOTYPE:
|
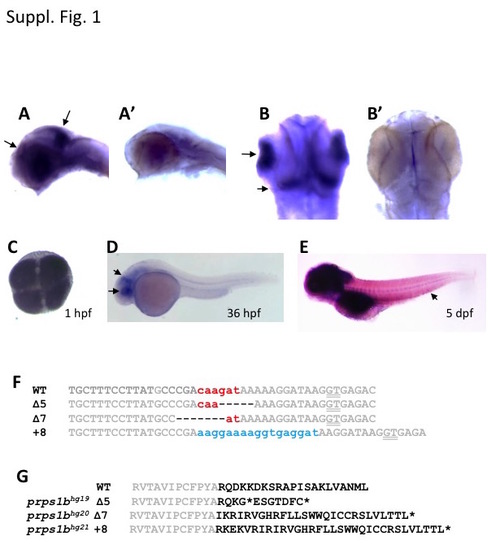
prps1 gene expression and prps1b mutations. (A-B) Flat mount images show the specific expression of prps1a in the retina and mid-brain hindbrain boundary. Wild-type embryos at 36 hpf were used for whole-mount in situ hybridization analysis with the antisense (A,B) and sense (A',B”) probes. A and A', lateral views. B and B', dorsal views. Black arrows in A and B point to the staining in the retina and brain. (C-E) prps1b expression in the wild-type embryos at the 4-cell stage (C), 36 hpf (D) and 5 dpf (E), detected by whole-mount in situ hybridization. Black arrows in D point to the enrichment in eye and tectum. Arrow in E points to the enrichment in caudal hematopoietic tissue. Images in C and D are processed for the same amount of time. Image in E is from an extended staining to show the expression in the caudal hematopoietic tissue. (F) DNA sequence alignment of the three prps1b frame-shift mutations. The wild-type (WT) DNA sequence is from Vega transcript OTTDART00000037699. ZFN target sites are shown in grey. Spacer sequence is shown in red. Deletions are shown as dashes (-). Insertions are shown in blue. Splice site GT is underlined. (G) Protein sequence alignment of the three prps1b frame-shift mutations. The WT protein sequence is from UniProt: Q08CA5_DANRE. Conserved residues are shown in grey. Premature stop codons are shown as asterisks (*). There are presumably 2, 23 and 9 extra amino acid residues introduced prior to the premature stop codon for the 5 bp deletion, 7 bp deletion, and 8 bp insertion mutations, respectively. For the 5 bp deletion mutation, there is a second premature stop codon shortly after the first one. |
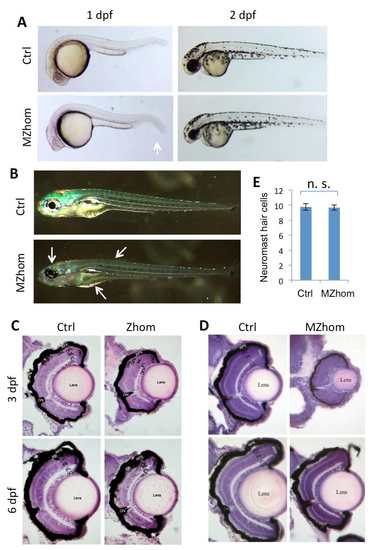
prps1a mutant phenotypes. (A) The smaller eye phenotype in prps1a MZhom embryos at 1 dpf and 2 dpf. White arrow indicates easily visible reduction in size. (B) Reduced iridophores in prps1a MZhom at 5 dpf. White arrows show where the reduction of iridophores in the head, trunk and yolk are most easily seen. (C) Retinal morphology of prps1a Zhom embryos at 3 dpf and 6 dpf. (D) Retinal morphology of prps1a MZhom embryos at 3 dpf and 6 dpf. CMZ, ciliary marginal zone. GCL, ganglion cell layer. IPL, inner plexiform layer. INL, inner nuclear layer. OPL, outer plexiform layer. ONL, outer nuclear layer. PR, photoreceptor. RPE, retina pigment epithelium. Eyes are most reduced at 3 dpf, but begin to recover by day 6. (E) prps1a homozygous mutants have a normal number of neuromast hair cells at 5 dpf. The difference between the control and mutants is not significant (n=10, p=0.87). |
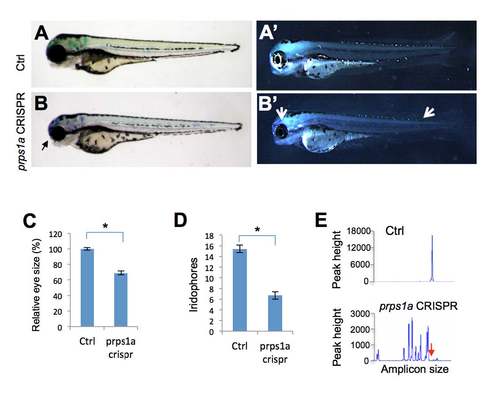
prps1a CRISPR mutant phenotypes. (A-B) Small eye phenotype in prps1a CRISPR mutants at 3 dpf. Black arrow points to the small eye in the mutant. (A’-B’) Iridophore phenotype in prps1a CRISPR mutants at 3 dpf. Two white arrows point to the reduced iridophores in the eye and dorsal trunk of the mutant. (C-D) Quantification of the reduction in eye size (C) and iridophores (D). The eye areas were calculated using image J. The numbers of iridophores were obtained by counting the iridophores in the dorsal and ventral side of the trunk area above the yolk extension. The reduction was significant in the eye size (n=10, p<0.001) and iridophores (n=10, p<0.001). (E) Representative fluorescent PCR plots showing the peaks indicating efficient somatic mutation. The representative plots are from Control # 4 and prps1a CRISPR #6 embryos (details in Suppl. Table 1). The X-axis represents the size of the target amplicon. The Y-axis shows the peak height for each amplicon size. The red arrow points to the position of the WT peak. All peaks shown are within 50 base pair of the WT peak. Ctrl is uninjected sibling fish.PHENOTYPE:
|
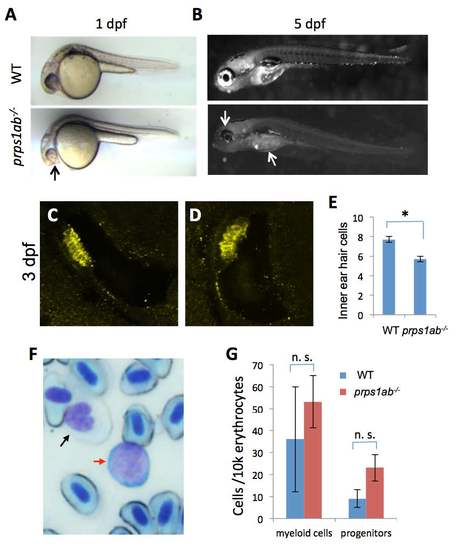
prps1a;prps1b double mutant phenotypes. (A) Reduced melanocyte pigmentation in the double mutant at 1 dpf. prps1ab-/- indicates prps1a;prps1b double mutant. Black arrow points to the small and poorly-pigmented eye of the double mutant. (B) Reduced iridophores in the double mutants at 5 dpf. White arrows indicate the reduced iridophores in the eye and yolk of the double mutant. (C-D) Inner ear hair cells in 3 dpf embryos were stained with a combination of myosin-VIIa and hair cell soma-1 antibodies. 11 embryos per group were used for inner ear hair cell analysis. Representative images are shown. (E) Quantification of the reduction of inner ear hair cells. The reduction in the double mutants is significant (n=11, p<0.003). (F) Blood cell lineage analysis by Wright Giemsa staining. Black arrow indicates a myeloid cell and red arrow indicates a progenitor cell. Other cells are erythrocytes. (G) Quantification of myeloid cells and progenitors in the 3 control adults and 3 double mutant adults at 4 months. The differences were not significant (n. s.). |
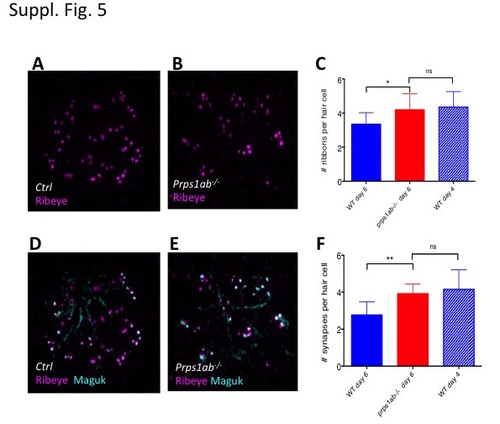
Analysis of presynaptic ribbons and synapse of neuromast hair cells in the double mutant. (A-C) Increased presynaptic ribbons in the double mutants. (A, B) Morphology of Ribeye stained presynaptic ribbons of neuromast hair cells in the control (A) and double mutant (B) embryos at 6 dpf. (C) Quantification of the number of presynaptic ribbons in the control and mutant embryos at 6 dpf, as well as in wild-type embryos at 4 dpf. (D-F) Increased synapses in the double mutants. (D,E) Morphology of Maguk stained synapses and Ribeye stained presynaptic ribbons of neuromast hair cells in the control (D) and double mutant (E) at 6 dpf. (F) Quantification of the number of synapses in the control and mutant embryos at 6 dpf, as well as in wild-type embryos at 4 dpf. The numbers of neuromasts analyzed for each staining were 12, 13, and 10 for control, double mutant, and wild type embryos at 4 dpf, respectively. PHENOTYPE:
|
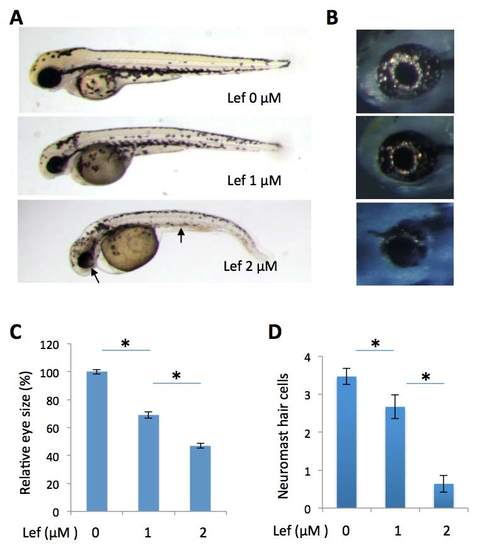
Inhibition on pyrimidine synthesis by leflunomide partially phenocopies the prps1a:prps1b mutant phenotypes. (A) Leflunomide treatment of wild-type embryos leads to a dose-dependent reduction in melanocytes and eye size. Leflunomide concentrations are as labeled. Arrows point to small eye and melanocyte reduction in the embryo treated with 2 uM of leflunomide. (B) Dose-dependent reduction of retinal iridophores in leflunomide treated embryos. (C) Quantification of eye size reduction. Eye size is measured by Image J. A significant reduction in eye size is detected between leflunomide at 0 uM and1 uM (n=10, p<0.001), and between leflunomide at 1 uM and 2 uM (n=10, p<0.001). (D) Dose-dependent reduction of neuromast hair cells in leflunomide treated embryos. A significant reduction in neuromast hair cells is detected between leflunomide at 0 uM and 1 uM (n=9, p=0.03), and between leflunomide at 1 uM and 2 uM (n=9, p<0.001). Graphs show the mean and s. e. m.. The data shown were replicated in another independent experiment. |
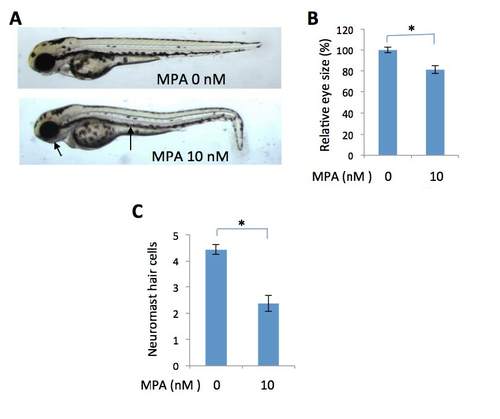
Inhibition on purine synthesis by mycophenolate mofetil partially phenocopies the prps1a:prps1b mutant phenotypes. (A) Mycophenolate mofetil (MPA) treatment of wild-type embryos causes a reduction in melanocytes and eye size. Arrows point to small eye and melanocyte reduction in MPA-treated embryo. (B) Quantification of eye size reduction. Eye size was measured by Image J. There is a significant reduction of eye size in MPA-treated embryos (t-test, p<0.001). (C) Reduced neuromast hair cells in the treated embryos (t-test, p<0.001). Eye area and neuromast hair cell analysis were performed with 10 embryos for each group. Graphs show the mean and s. e. m.. The data shown were replicated in an additional independent experiment. |
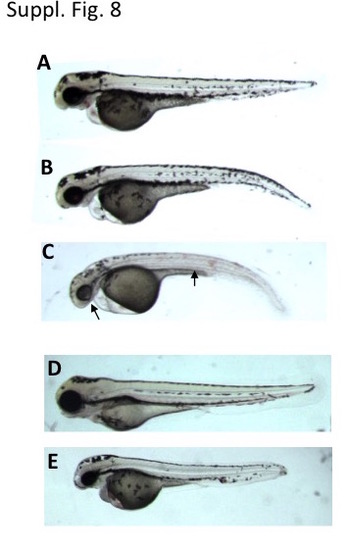
prps1a:prps1b double mutants are sensitive to inhibitions of nucleotide synthesis and ATP production. (A-C) Morphology of embryos treated with 1 μM of leflunomide. A total of 76 embryos generated from a pairwise incross of adult fish carrying prps1a heterozygotic and prps1b homozygotic mutations were used for leflunomide treatment from 6 hpf until 3 dpf. Phenotype classification was performed at 3 dpf, with 19 embryos displaying a morphology as shown in panel A, 38 embryos as in panel B, and another 19 embryos as in panel C. Genotyping for prps1a mutation was conducted for 19 embryos from each class. The 19 embryos as in panel A included 8 wildtype and 11 heterozygotes. The 19 embryos as in panel B included 4 wild-type, 8 heterozygotes and 7 homozygotes. The 19 embryos as in panel C included 1 wild-type, 7 heterozygotes and 11 homozygotes. (D-E) Morphology of embryos treated with 0.5 ng/ml of antimycin A. A total of 32 embryos obtained as above were used for antimycin A treatment from 24 hpf until 3 dpf. Phenotype classification was performed at 3 dpf, with 24 embryos displaying a morphology as shown in panel D, and 8 embryos as in panel E. Genotyping for prps1a mutation revealed 11/11 embryos as in panel D were wild-type or heterozygotes for prps1a, and 8/8 embryos as in panel E were homozygotes for prps1a. |
|
ZFIN is incorporating published figure images and captions as part of an ongoing project. Figures from some publications have not yet been curated, or are not available for display because of copyright restrictions. |
|
Unillustrated author statements EXPRESSION / LABELING:
PHENOTYPE:
|