
- Title
-
Loss of laminin alpha 1 results in multiple structural defects and divergent effects on adhesion during vertebrate optic cup morphogenesis
- Authors
- Bryan, C.D., Chien, C.B., Kwan, K.M.
- Source
- Full text @ Dev. Biol.
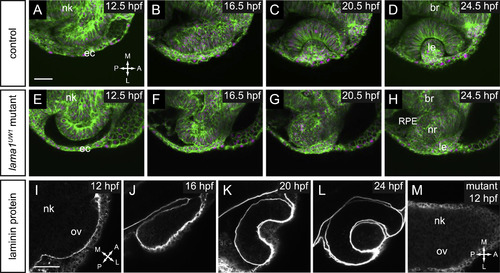
Timelapse confocal microscopy reveals severe defects in optic cup formation in lama1UW1 mutant. (A-H) Single confocal slices from 4D datasets of optic vesicle morphogenesis, 12.5-24.5 hpf. EGFP-CAAX (membranes, green), H2A.F/Z-mCherry (nuclei, magenta). (A-D) Optic cup formation in control embryo. (E-H) Optic cup formation in lama1UW1 mutant embryo. Dorsal views; scale bar, 50 µm. (I-M) Localization of laminin protein. (I-L) In control embryos, laminin protein is found lining basal surfaces of developing eye and brain. (M) lama1UW1 mutant embryo reveals absence of laminin protein from early stages of optic vesicle development. nk, neural keel; ov, optic vesicle; ec, ectoderm; br, brain; RPE, retinal pigmented epithelium; nr, neural retina; le, lens. A, anterior; P, posterior; M, medial; L, lateral. EXPRESSION / LABELING:
PHENOTYPE:
|
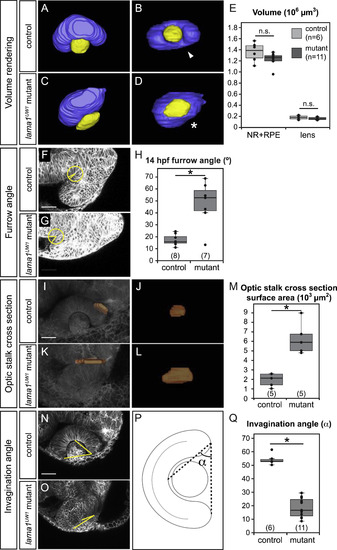
Quantitative analysis of lama1UW1 mutant phenotype. (A-E) Analysis of eye size at 24 hpf. (A-D) Volume renderings of control (A,B) and mutant (C,D) eyes. Neural retina + RPE (blue), lens (yellow). (A,C) Dorsal views. (B,D) Lateral views. arrowhead, choroid fissure; asterisk, choroid fissure missing in mutant. (E) Quantification of optic cup and lens volume in control and mutant eyes shows no significant difference in eye size. (F-H) Quantification of furrow angle during initial stages of optic stalk constriction. Single confocal section of control (F) and mutant (G) embryos, membrane channel (gray) at 14 hpf. A circle with a 25 µm radius was placed with its center at the vertex of the furrow, and angle was calculated by drawing radii to positions at which the circle intersected the optic vesicle and brain neuroepithelium. (H) Quantification of furrow angle demonstrates that the furrow exhibits a significantly larger angle in lama1UW1 mutants. (I-M) Visualization and quantification of optic stalk constriction. (I-L) 3D rendering of optic stalk cross-section (orange) over membrane channel (gray) at 24 hpf. (I,K) Dorsal views. (J,L) Face-on views of the optic stalk cross section. (M) Quantification of optic stalk cross section area shows that optic stalk constriction is impaired in lama1UW1 mutant embryos. (N-Q) Quantification of invagination angle. (N,O) Single confocal images of membrane channel (gray) in lama1UW1 control (N) and mutant (O) eyes at 24 hpf. Lines (yellow) were drawn to determine angle of invagination. (P) Schematic demonstrating how invagination angle (±) was determined. (Q) Quantification of invagination angle shows a severe defect in invagination in lama1UW1 mutant embryos. numbers at base of graph show embryos scored (one eye each);*P<0.001, using the student′s t-test. |
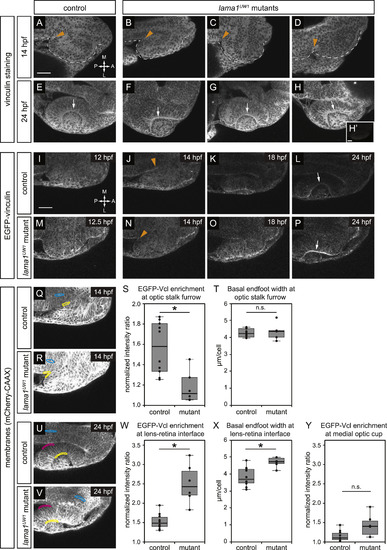
Focal adhesions are assembled in a specific spatiotemporal pattern, and are differentially disrupted by loss of lama1. (A-H) Antibody staining for the focal adhesion protein vinculin at 14 hpf (A-D) or 24 hpf (E-H), in control (A,E) or lama1UW1 mutant (B-D, F-H) embryos. (H’) No primary anti-vinculin antibody control. Orange arrowheads, location of optic stalk furrow; white arrows, lens-retina interface; dashed line, outline of optic vesicle. (I-P) Single confocal slices from 4D datasets of EGFP-vinculin (grayscale) localization during optic cup morphogenesis, ~12–24 hpf. (I-L) EGFP-vinculin recruitment in control embryo is apparent at the optic stalk furrow (J, orange arrowhead), and lens-retina interface (L, white arrow). (m-P) EGFP-vinculin recruitment in lama1UW1 mutant embryo at the optic stalk furrow (N, orange arrowhead), and lens-retina interface (P, white arrow). Dorsal views; scale bar, 50 µm. A, anterior; P, posterior; M, medial; L, lateral. (Q-Y) Quantification of EGFP-vinculin recruitment at the optic stalk furrow and lens-retina interface. (Q,R,U,V) mCherry-CAAX (membranes, gray) localization in same single confocal slices as J,N,L,P, respectively. At the optic stalk furrow or lens-retina interface (Q,R,U,V; yellow regions), EGFP-vinculin fluorescence intensity was normalized to mCherry-CAAX. Enrichment was measured by comparing to normalized EGFP-vinculin fluorescence intensity at the midline (Q,R,U,V; cyan regions). A control medial optic cup domain (U,V; magenta regions) was quantified as a location where EGFP-vinculin recruitment was not noted; this domain was also compared to normalized EGFP-vinculin fluorescence intensity at the midline (U,V; cyan regions). (S) Quantification of EGFP-vinculin recruitment indicates decreased ECM adhesion at the optic stalk furrow in the lama1UW1 mutant. (T) Average basal endfoot width at the optic stalk furrow, based on counting the number of cells within the quantified region; no significant difference indicates that differences in cell morphology at that position (e.g. basal constriction) cannot strictly account for differences in apparent EGFP-vinculin recruitment. (W) Quantification of EGFP-vinculin recruitment indicates increased ECM adhesion at the lens-retina interface in the lama1UW1 mutant. (X) Average basal endfoot width at the lens-retina interface, based on counting the number of cells within the quantified region; lama1UW1 mutants have fewer cells with wider basal surfaces, indicating that increased cell number or constriction cannot account for apparent increased EGFP-vinculin recruitment at the mutant basal surface. (Y) Quantification of EGFP-vinculin recruitment at a control site in the medial optic cup where no enrichment of vinculin recruitment occurred in control or lama1UW1 mutants. Quantifications were performed on 10 control embryos and 6 mutant embryos (one eye scored per embryo); n.s., not significant;*P<0.005, using a two-tailed t-test of unequal variance. EXPRESSION / LABELING:
PHENOTYPE:
|
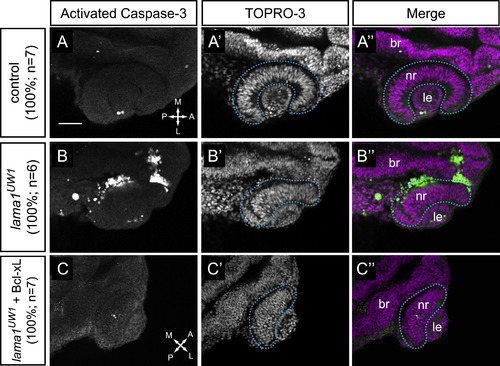
Apoptosis is increased in lama1UW1 mutant embryos but is not the underlying cause of morphogenesis defects. (A-A′′) Control embryos show little apoptotic cell death. (B-B′′) lama1UW1 mutant embryos contain a significant number of dying cells. (C-C′′) Injection of Bcl-xL RNA (100 pg) rescues apoptosis in lama1UW1 mutant embryos, however optic cup morphogenesis defects are still apparent. (A,B,C) Antibody staining for activated caspase-3. (A′,B′,C′) TOPRO-3 counterstain for nuclei. (A′′, B′′, C′′) Merged images. dashed blue line, boundary of optic cup. Dorsal views; scale bar, 50 µm. br, brain; nr, neural retina; le, lens. A, anterior; P, posterior; M, medial; L, lateral. PHENOTYPE:
|
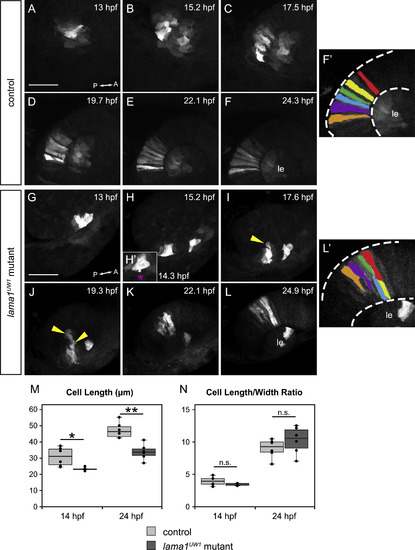
Loss of motile cell behaviors does not underlie optic cup morphogenesis defects in lama1UW1 mutant embryos. Retinal progenitors expressing Kaede were exposed to 405 nm light, which converts Kaede from green to red fluorescence via an irreversible photocleavage. Images are maximum intensity projections from 4-dimensional datasets of the red (converted) channel. (A-F′) Images from a timelapse of a lama1UW1 control sibling embryo. (G-L′) Images from a timelapse of a mutant embryo. (H′) Zoomed image of single timepoint (14.3 hpf) showing a retinal progenitor extending a bleb (magenta asterisk) beyond the boundary of the optic vesicle. (F′, L′) Pseudocolor of marked retinal cells. Retinal progenitors in the control embryo extend across the entire width of the retina, while retinal progenitors in the lama1UW1 mutant embryo elongate, but do not span the width of the retina. Loss of apicobasal register marked by arrowheads. (M, N) Comparisons of length (M) or length/width ratio (N) of retinal progenitors in lama1UW1 mutant or control embryos. While retinal progenitors are longer in control embryos than mutants, the length/width ratio is not significantly different. *P<0.02;**P<0.001; n.s. = not significant. Dorsal views; scale bar, 50 µm. le, lens; dashed lines, retina margins. A, anterior; P, posterior. PHENOTYPE:
|
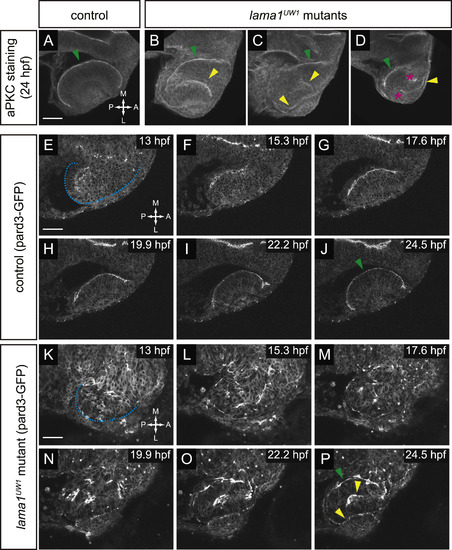
Apicobasal polarity is disrupted from the earliest stages of optic vesicle morphogenesis. (A-D) Antibody staining for aPKC in control (A) and lama1UW1 mutant embryos (B-D) reveals disruption of polarity at 24 hpf. green arrowheads, correct apical domain. yellow arrowheads, ectopic apical domains. asterisks, ectopic puncta. (E-P) Single confocal sections from 4D datasets of apical domain dynamics (marked by pard3-GFP) in a lama1UW1 control embryo (E-J), or a mutant embryo (K-P). In lama1UW1 mutant embryos, pard3-GFP localization is disrupted similar to aPKC. dashed blue line marks outline of optic vesicle. green arrowheads, correct apical domain. yellow arrowheads, ectopic apical domains. Dorsal views; scale bar, 50 µm. A, anterior; P, posterior; M, medial; L, lateral. |
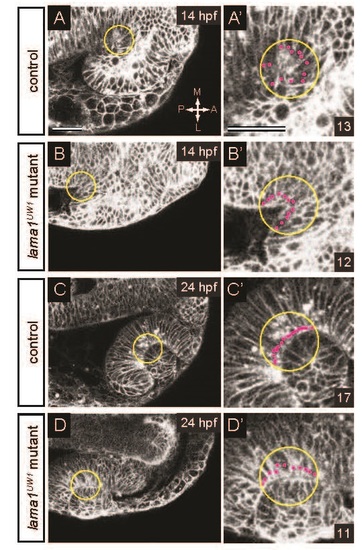
Method for measuring basal endfoot width. (A-B′) At 14 hpf, a 25 µm radius circle (yellow) was centered at the vertex of the optic stalk furrow. (C-D′) At 24 hpf, a 25 µm circle (yellow) was centered at the deepest point of the lens-retina interface. In all cases, basal surface length was measured using ImageJ. Within the circle, the number of cells in contact with the basal surface was counted (magenta dots). Average basal endfoot width was calculated by dividing the basal surface length by the number of cells in contact with it. (A-D) Single confocal sections for measurements. (A′-D′) Zoomed images. Numbers in bottom right insets are numbers of cells in contact with the basal surface in that image. Dorsal views; scale bar, 50 µm. A, anterior; P, posterior; M, medial; L, lateral. |
Reprinted from Developmental Biology, 416(2), Bryan, C.D., Chien, C.B., Kwan, K.M., Loss of laminin alpha 1 results in multiple structural defects and divergent effects on adhesion during vertebrate optic cup morphogenesis, 324-37, Copyright (2016) with permission from Elsevier. Full text @ Dev. Biol.