
- Title
-
In vivo Modeling Implicates APOL1 in Nephropathy: Evidence for Dominant Negative Effects and Epistasis under Anemic Stress
- Authors
- Anderson, B.R., Howell, D.N., Soldano, K., Garrett, M.E., Katsanis, N., Telen, M.J., Davis, E.E., Ashley-Koch, A.E.
- Source
- Full text @ PLoS Genet.
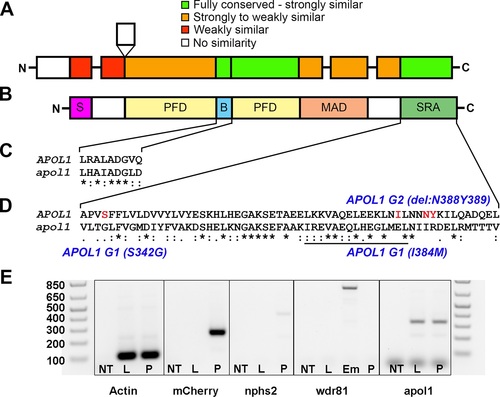
Comparison of APOL1 human and zebrafish protein sequences and relevance to the zebrafish kidney. Protein domain schematic of (A) zebrafish APOL1 and (B) human APOL1 is shown, with zebrafish domains (NP_001025309) aligned to the human protein (NP_001130012) and coded based on summarized consensus scores (Gonnet PAM 250 matrix, Clustal Omega, Cambridge, UK; S, secretory domain, PFD, pore-forming domain, B, BH3 domain, MAD, membrane-addressing domain, SRA, serum resistance-associated binding domain). Prominent regions of the human and zebrafish alignments are expanded, including the (C) BH3 domain and (D) SRA binding domain, and consensus symbols are displayed (* (asterisk), fully conserved;: (colon), >0.5 in the Gonnet PAM 250 matrix;. (period), = <0.5 in the Gonnet PAM 250 matrix). The leucine zipper domain (codons 365–392 in APOL1, underline), and the location of the G1 and G2 risk alleles in CKD in African Americans (S342G/I384M and ΔN388Y389) are highlighted in red. (E) Podocytes from adult glomeruli of pod::NTR-mCherry zebrafish were flow-sorted and evaluated for apol1 RNA expression through RT-PCR. apol1 is expressed in fluorescence-activated cell sorted (FACS) podocytes and the adult liver. FACS podocytes also express zebrafish podocin (nphs2) but a purkinje-cell marker, wdr81[29], was undetectable. NT = non-template reverse transcription control; L = dissected adult liver cells from pod::NTR-mCherry zebrafish; P = fluorescence-activated cell sorted podocytes from dissected glomeruli of pod::NTR-mCherry zebrafish; Em = 5 dpf whole-zebrafish embryo cDNA. |
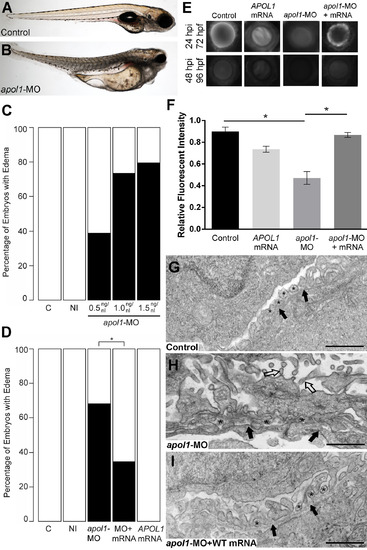
apol1 morphant zebrafish embryos display generalized edema and glomerular filtration defects indicative of nephropathy. Representative live images of (A) sham-injected control larvae, and (B) apol1 morpholino (MO) injected larvae at 5 dpf. apol1 morphants display pericardial and yolk sac edema. (C) Injection of increasing doses of apol1-MO demonstrate dose-dependent effects when scored for generalized edema (n = 35–65 embryos/injection; repeated three times) compared to control larvae at 5 dpf. apol1 morpholino injected embryos were complemented with the respective human mRNA to APOL1 (100pg/nl) and scored for generalized edema at 5 dpf. (D) Ectopic expression of APOL1 rescues significantly the edema phenotype observed in apol1 morphants (1.0 ng/nl dose). We observed no significant phenotypes when APOL1 human mRNA is injected alone. 70kDa dextran-FITC conjugate was injected into the cardiac venous sinus of 48 hpf zebrafish larvae and fluorescence intensity in the eye vasculature was measured at 24 and 48 hpi. (E) Representative eye image series of zebrafish larvae for each injection group show a relatively stable or a decrease in fluorescence intensity over time compared to sham-injected controls. (F) Bar graphs summarize the fluorescence changes observed for each injection group for apol1 morphant larvae. Reduction in fluorescence intensity over the pupil was calculated relative to the 24 hpi time point; apol1 morphants display increased glomerular clearance of 70kDa dextran-FITC compared to control embryos over time, indicative of compromised glomerular filtration and proteinuria. These defects were rescued significantly when MO was co-injected with orthologous human mRNA. (G-I) Compared to (G) sham-injected controls, the glomerular ultrastructure of (H) apol1 morphant zebrafish display partial effacement of podocyte foot process (* asterisks), although the glomerular basement membrane (filled arrowheads) appears normal. Microvillus protrusions (open arrowheads) are also apparent in the urinary space. (I) Ultrastructure defects are rescued upon co-injection of human wild-type mRNA (100pg). Scale bar, 500nm. White bars, normal; black bars, edema. MO concentrations are in µg/µl, with 1nl injected into each embryo. C, sham-injected control; NI, non-injected control. Dextran values are in relative fluorescent intensity, mean ± SE. Control, sham-injected control (n = 29); MO, apol1 morpholino injected (n = 26); apol1-MO+mRNA (n = 28). h.p.f., hours post-fertilization; h.p.i., hours post-injection. *p<0.001. PHENOTYPE:
|
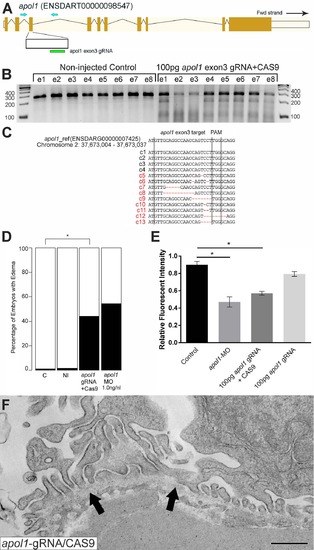
apol1-CRISPR F0 zebrafish embryos reproduce phenotypes observed in apol1 morphants. (A) Schematic of the zebrafish apol1 locus and location of the guide RNA (gRNA) target used for apol1-CRISPR experiments; the primers used to PCR-amplify the target region are shown (arrowheads). (B) At 1 dpf, a representative sampling of 8 founders and 8 non-injected controls were selected and subjected to T7 endonuclease 1 (T7E1) assay. The appearance of T7E1 fragments at ~180bp indicate positive gRNA targeting of exon 3 in the apol1 locus. No T7E1 fragments were detected in non-injected control embryos. In total, 25 out of 41 founders subjected to T7E1 assay showed the presence of T7E1 fragments, indicating that ~61% of founders have insertion/deletions (indels) in the exon 3 region of apol1. (C) Multiple sequence alignment of apol1 reference sequence (ENSDARG00000007425) to apol1-CRISPR variants generated from PCR amplification and subsequent TA cloning and sequencing of two representative apol1-gRNA/CAS9 injected founders. 13 PCR-cloned sequences are shown, representing four wild-type variants (c1-4) and all indel types detected among 50 PCR-clones (c5-13). Of 50 total PCR-clones sequenced, 31 showed detectable indels, representing an estimated 62% mosaicism in apol1-CRISPR/CAS9 injected founders. Lines mark the specific sequence targeted by the apol1-gRNA (exon3) and the location of the PAM recognition motif (i.e. TGG). (D) apol1-gRNA and CAS9 co-injected embryos were scored for edema formation at 5 dpf (n = 26–31 embryos/injection, repeated three times; *p<0.001). (E) apol1-gRNA and CAS9 co-injected embryos display increased glomerular clearance of 70kDa dextran-FITC compared to control embryos over time, similar to that of apol1-MO injected embryos (*p<0.001). Bar graphs summarize the changes for each injection group. Dextran values are in relative fluorescence intensity, mean ± SE. Control, sham-injected control (n = 19–21); apol1-gRNA+CAS9 (n = 11–17); apol1-gRNA alone (n = 13–14), repeated 2 times. (F) apol1-CRISPR/CAS9 injected embryos display podocyte foot process effacement at 5 dpf, similar to that of apol1 morphant larvae. Ultrastructural defects appear less severe when compared to apol1-MO injected embryos, however, including less foot process effacement and the absence of microvilli in the urinary space. Filled arrowheads, glomerular basement membrane. Scale bar, 500nm. PHENOTYPE:
|
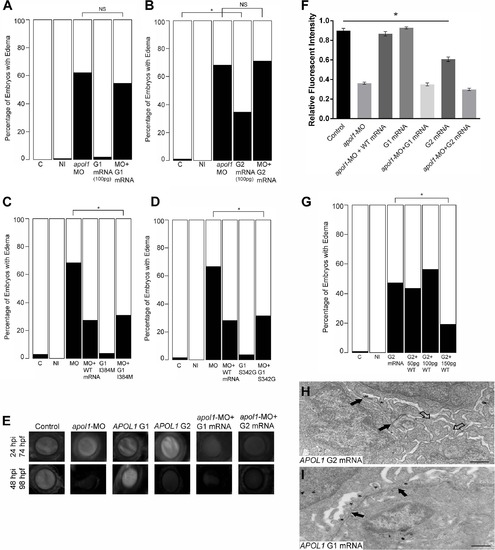
In vivo modeling of human APOL1 variants associated with disease. apol1 MO injected larvae were complemented with the respective human mRNA corresponding to APOL1 G1 (S342G/I384M) (100pg/nl) and G2 (100pg/nl) risk variants and scored for edema formation at 5 dpf (n = 26–65 embryos/injection; repeated three times). (A, B) Neither risk variant of APOL1 rescues significantly the edema phenotype observed in apol1 morphants. However, when human APOL1 G2 mRNA was injected alone (B), a significant number of embryos develop edema compared to sham-injected controls, suggesting a possible dominant-negative effect of the G2 altered protein. (C, D) apol1 morpholino injected larvae were complemented with human mRNA corresponding to either (C) APOL1 G1 I384M or (D) APOL1 G1 S342G and scored for edema formation at 5 dpf (n = 48–93 embryos/injection; repeated two times). Each individual variant comprising APOL1 G1 risk rescues significantly edema formation in apol1 morphant embryos, suggesting that both G1 variants must be present to confer loss of APOL1 function. (E-F) apol1 morphants co-injected with human APOL1 G1 or G2 mRNA fail to rescue filtration defects as indicated by dextran clearance, while larvae injected with G2 mRNA alone display increased clearance over time. (G) Titration of G2 injected embryos with increasing concentrations of human WT APOL1 mRNA show a significant reduction in edema formation of developing embryos at 5 dpf. (H) Zebrafish embryos injected with APOL1 G2 mRNA (100pg/nl) alone display glomerular aberrations similar to that of myh9 suppressed larvae, with microvillus protrusions present (open arrowheads), although the glomerular basement membrane appears normal (filled arrowheads). Podocyte foot processes (* asterisk) are apparent, although sparsely present. (I) Embryos injected with APOL1 G1 mRNA (100pg/nl) alone display normal glomerular ultrastructure. Scale bar, 500nm. White bars, normal; black bars, edema. C, sham-injected control; NI, non-injected control. *p<0.05. |
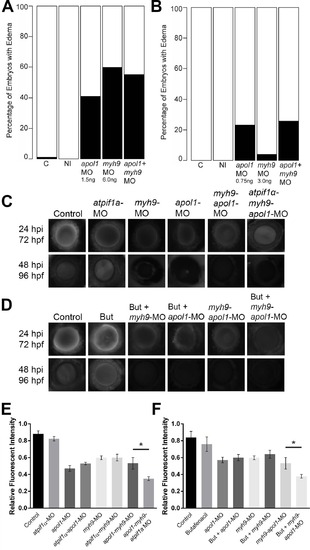
apol1 interacts with myh9 in an anemic context. To test for epistatic effects of apol1 and myh9 in zebrafish, we first co-injected both apol1-MO (1.0ng/nl dose) and myh9-MO (6.0ng/nl dose) into zebrafish larvae and scored for edema formation at 5 dpf. (n = 39–89 embryos/injection; repeated three times). However, under this co-suppression model (A, B), we observed no significantly increased edema formation compared to each MO alone. We next tested for an interaction between apol1 and myh9 in the context of atpif1a suppression, predicting that the added stress of anemia would mimic our initial observations in sickle cell disease patients. 70kDa dextran-FITC conjugate was injected into the cardiac venous sinus of 48 hpf zebrafish larvae and fluorescence intensity in the eye vasculature was measured at 24 and 48 hours later. (C) Representative eye image series of zebrafish embryos for each injection group show relatively stable or decreased fluorescence intensity over time. (E) Bar graphs summarize the changes observed for each injection group. Zebrafish embryos injected with all three MOs show a significant increase in dextran clearance from the vasculature compared to co-suppression of apol1 and myh9. (D, F) These data are reproduced using butafenacil induced anemia (0.195 µM in embryo media, treated at 48 hpf). Dextran values are in relative fluorescence intensity, mean ± SE. Control, sham-injected control (n = 19); atpif1a MO injected (n = 14); apol1-MO+myh9-MO (n = 12); apol1-MO+myh9-MO+atpif1a-MO (n = 11); Butafenacil (n = 48); But+myh9-MO+apol1-MO (n = 18). hpf, hours post-fertilization; hpi, hours post-injection. *p<0.001. PHENOTYPE:
|
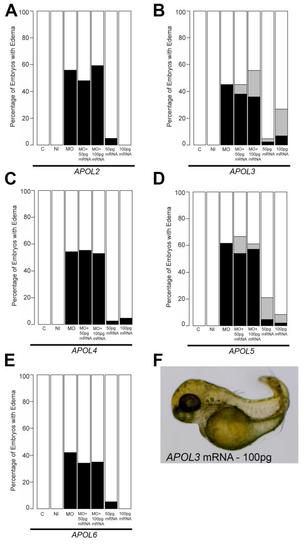
Complementation of zebrafish apol1 morphants with other members of the human APOL gene cluster. (A-E) Human mRNA corresponding to APOL2, APOL3, APOL4, APOL5, and APOL6 (100pg/nl) were each co-injected with apol1 MO and scored for edema at 5 dpf. Ectopic expression of each of the other members of the human APOL gene cluster was unable to rescue significantly the edema formation in developing embryos co-injected with apol1 MO. (F) We observed a novel body axis phenotype in embryos injected with either APOL3 or APOL5 alone, although this did not seem to be relevant to kidney dysfunction. White bars, normal; black bars, edema; grey bars, adverse. C, sham-injected control; NI, non-injected control; n = 32–68 embryos/injection batch; masked scoring. |
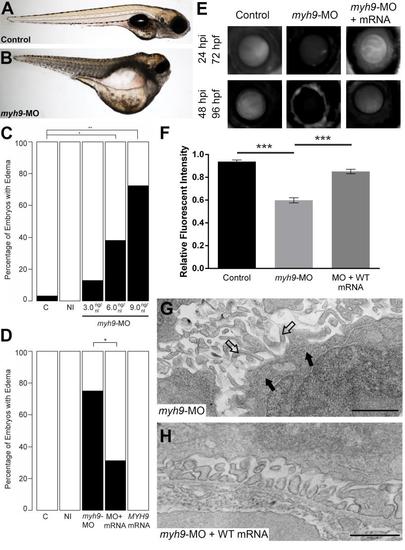
myh9 suppression and complementation in developing zebrafish embryos. We recapitulated data reported by Müller et al. for experimental comparison [17]. (A-B) Representative live images of sham-injected control and myh9 morpholino (MO) injected larvae at 5 dpf. (C) Injection of increasing doses of myh9 MO demonstrate dose-dependent effects when scored for generalized edema compared to control embryos at 5 dpf. (E-F) myh9 morphants also display filtration defects indicated by significantly increased dextran clearance. (D-F) Co-injection of wild-type human MYH9 mRNA (100pg/nl) significantly rescues edema formation and filtration defects observed in myh9 morphants. (G) As reported previously by Müller et al., myh9 morphants display ultrastructure abnormalities, including glomerular basement membrane thickening and the presence of microvillus protrusions in the urinary space. (H) These ultrastructural defects are rescued upon co-injection of wild-type human MYH9 mRNA (100pg). White bars, normal; black bars, edema; n = 49–70 and n = 13–29 embryos/injection batch for gross morphological scoring and glomerular filtration assays, respectively; *p<0.05; **p<0.01; ***p<0.001; filled arrowheads, glomerular basement membrane; open arrowheads, microvillus protrusions. PHENOTYPE:
|
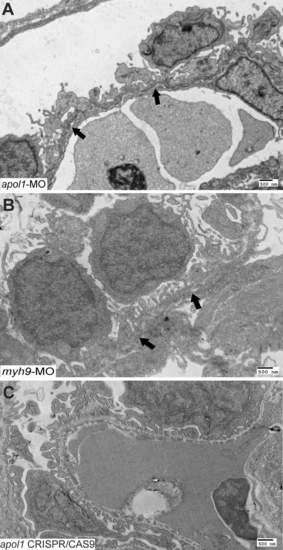
Further characterization of apol1 and myh9 morphant glomerular ultrastructure. Transmission electron microscopy of zebrafish larval glomeruli injected with either (A) apol1-MO or (B) myh9-MO were imaged at 5 dpf using a low magnification (direct mag = 4400X) to characterize long stretches of the glomerular basement membrane (GBM). Comparatively, apol1 and myh9 morphants display similar abnormalities, including podocyte disorganization and effacement, as well as the presence of microvillus protrusions. However, myh9 morphants display a thickened GBM that is not apparent in apol1-MO injected larvae, while apol1 morphants appear to have a higher degree of podocyte effacement compared to myh9 morphants. (C) Zebrafish larvae injected with apol1 CRISPR/CAS9 display a similar glomerular ultrastructure compared to apol1 morphants at 5 dpf. Filled arrowheads, glomerular basement membrane. Scale bar = 500nm. PHENOTYPE:
|
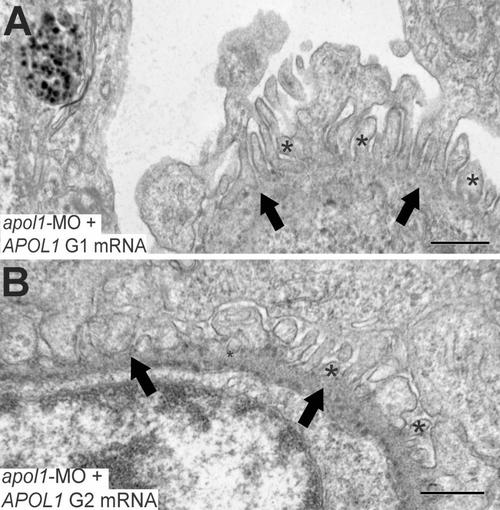
Glomerular ultrastructure of apol1 morphants complemented with human risk alleles. Transmission electron microscopy of zebrafish larval glomeruli imaged at 5 dpf. (A, B) apol1 morphants complemented with risk alleles, G1 and G2 do not rescue the observed defects caused by apol1 suppression, with naked patches of glomerular basement membrane and microvillus processes apparent. *, microvillus protrusions; filled arrowheads, glomerular basement membrane. Scale bars, 500nm. |