
Fig. 4
- ID
- ZDB-FIG-150921-39
- Publication
- Anderson et al., 2015 - In vivo Modeling Implicates APOL1 in Nephropathy: Evidence for Dominant Negative Effects and Epistasis under Anemic Stress
- Other Figures
- All Figure Page
- Back to All Figure Page
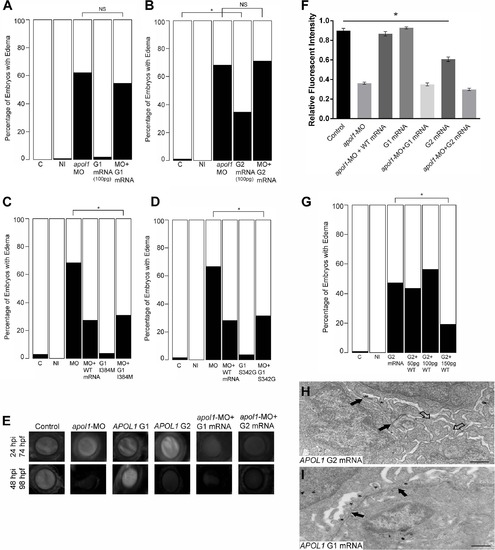
In vivo modeling of human APOL1 variants associated with disease. apol1 MO injected larvae were complemented with the respective human mRNA corresponding to APOL1 G1 (S342G/I384M) (100pg/nl) and G2 (100pg/nl) risk variants and scored for edema formation at 5 dpf (n = 26–65 embryos/injection; repeated three times). (A, B) Neither risk variant of APOL1 rescues significantly the edema phenotype observed in apol1 morphants. However, when human APOL1 G2 mRNA was injected alone (B), a significant number of embryos develop edema compared to sham-injected controls, suggesting a possible dominant-negative effect of the G2 altered protein. (C, D) apol1 morpholino injected larvae were complemented with human mRNA corresponding to either (C) APOL1 G1 I384M or (D) APOL1 G1 S342G and scored for edema formation at 5 dpf (n = 48–93 embryos/injection; repeated two times). Each individual variant comprising APOL1 G1 risk rescues significantly edema formation in apol1 morphant embryos, suggesting that both G1 variants must be present to confer loss of APOL1 function. (E-F) apol1 morphants co-injected with human APOL1 G1 or G2 mRNA fail to rescue filtration defects as indicated by dextran clearance, while larvae injected with G2 mRNA alone display increased clearance over time. (G) Titration of G2 injected embryos with increasing concentrations of human WT APOL1 mRNA show a significant reduction in edema formation of developing embryos at 5 dpf. (H) Zebrafish embryos injected with APOL1 G2 mRNA (100pg/nl) alone display glomerular aberrations similar to that of myh9 suppressed larvae, with microvillus protrusions present (open arrowheads), although the glomerular basement membrane appears normal (filled arrowheads). Podocyte foot processes (* asterisk) are apparent, although sparsely present. (I) Embryos injected with APOL1 G1 mRNA (100pg/nl) alone display normal glomerular ultrastructure. Scale bar, 500nm. White bars, normal; black bars, edema. C, sham-injected control; NI, non-injected control. *p<0.05. |