
- Title
-
Classification of Object Size in Retinotectal Microcircuits
- Authors
- Preuss, S.J., Trivedi, C.A., Vom Berg-Maurer, C.M., Ryu, S., Bollmann, J.H.
- Source
- Full text @ Curr. Biol.
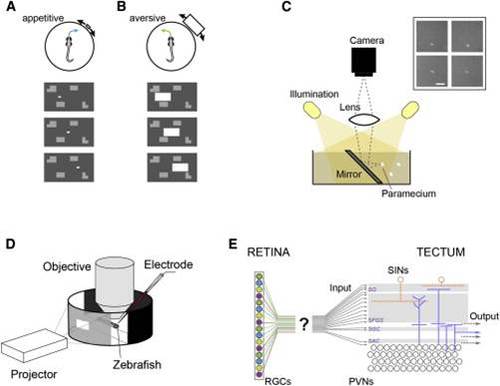
Size Discrimination in the Retinotectal Pathway using Ethological Stimuli (A and B) “Appetitive” versus “aversive” swim. A zebrafish larva performs swims directed toward a small moving target (A) or away from a large target (B). The stimulus paradigm is shown in the bottom panels; a white rectangle moves on a gray background with stationary objects. (C) Configuration for imaging paramecia as seen from the perspective of hunting zebrafish. Inset: examples of paramecia. Note that paramecia appear as bright objects on a dark background. Scale bar, 0.5 mm. (D) Experimental set up for multiphoton imaging and patch-clamp recordings, in combination with behaviorally relevant visual stimulation. (E) The retina contains functionally distinct RGC subtypes (schematically highlighted by color). The tectum receives RGC input mainly in the superficial layers (stratum opticum and stratum fibrosum et griseum superficiale), but how functionally distinct RGC subtypes map onto these layers is unclear. |
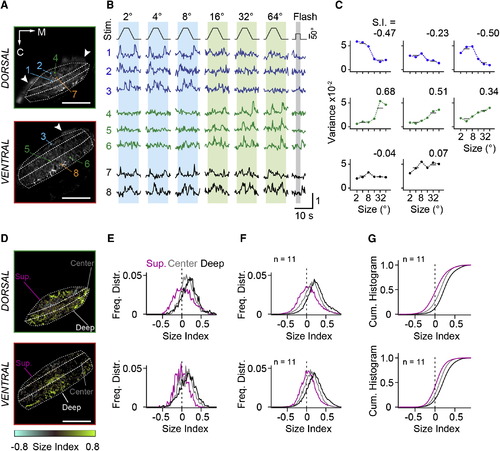
RGC Inputs to Tectal Neuropil Carry Small- and Large-Size-Selective Signals (A) Two optical sections from tectal neuropil with GCaMP6m expressed in RGC fibers. Imaging depth is 18 µm and 51 µm from the dorsal crest. Dashed lines indicate superficial, central, and deep layers. Colored boxes indicate eight representative ROIs. Arrowheads mark skin fluorescence. M, medial direction; C, caudal direction. (B) Normalized fluorescence signals from ROIs in response to moving targets and full-field flash. Object size is indicated above the stimulus trace. Numbers refer to ROIs indicated in (A). Note the whole-field flash OFF response in traces 6 and 8. (C) Size-tuning curves calculated from signal variance in ROIs indicated in (A). Variance was measured in intervals indicated by the blue (small-stimulus size) and green (large-stimulus size) vertical boxes in (B). Size index (S.I.) was calculated as S.I. = (Varlarge Varsmall) / (Varlarge + Varsmall). (D) Size selectivity maps for optical sections shown in (A) with corresponding color scale. (E) Normalized frequency distributions of size indices determined from single-pixel fluorescence signals, sorted for the superficial, center, and deep layers of the neuropil and displayed separately for the dorsal and ventral imaging plane. Data are from (D). (F) Average frequency distributions of size indices from 11 fish, for dorsal and ventral imaging planes. (G) Cumulative histograms of size indices. The same data as in (F) are shown. Scale bars, 50 µm (A and D). See also Figure S1. EXPRESSION / LABELING:
|
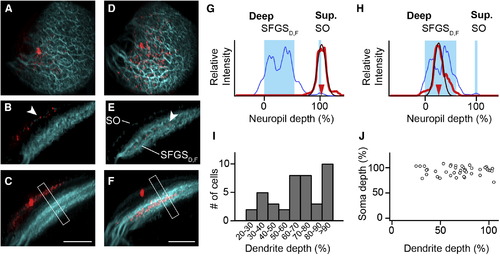
SINs Stratify in Different Sublayers of Retinorecipient Neuropil (A) Maximum-intensity projection showing a SIN filled with sulforhodamine (red) and retinal afferent fibers (cyan). A dorsal view is shown. (B) Transverse optical section through same cell as in (A). Dendrites of labeled SIN colocalize with the superficial SO band (arrowhead). (C) Maximum-intensity projection along same orientation as in (B). Dendrites remain in the SO layer. Note that the apparent broadening of the SIN dendrites (lower left) is caused by the tectal curvature. Compare also Movie S1. (D–F) Representation of a patched SIN in a different fish. The same orientation as in (A)–(C) is used. Note that dendritic tree stratifies in a narrow region of the deeper SFGSD,F. (G) Line profile analysis from boxed region in (C). The blue curve indicates GFP-expressing layers in SO and SFGSD,F. The red curve indicates the extent of the SIN dendritic tree. The thin red line is a Gaussian fit. (H) Line profile analysis for the cell in (F). Note: oblique sections and maximum-intensity projections in (B), (C), (E), and (F) were gamma corrected for visualization of the thin SO band, but line profiles were measured in uncorrected maximum-intensity projections. (I) Histogram of dendrite depth of individual SINs measured in the pou4f3:GFP background (n = 41). (J) Scatter plot of soma depth versus dendrite depth for individual SINs exhibits no significant correlation (p = 0.84, Spearman rank correlation). Scale bars, 40 µm (C and F). See also Figure S2 and Movie S1. |
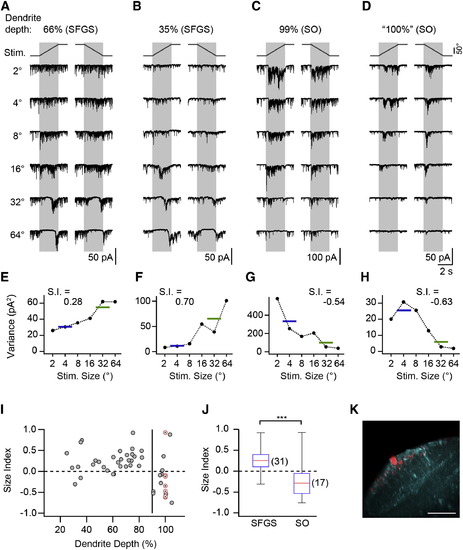
SINs Receive Size-Selective Excitatory Input (A) Synaptic current in a SIN with dendrite in upper SFGS. Note the strong background current, which is suppressed during the presentation of larger targets, and subsequent rebound from input suppression. (B) Recording from SIN with dendrites in deep SFGS with size-tuned synaptic input. (C) Recording from SIN with dendrites in the superficial SO. Note the increase in synaptic current during small target presentation. (D) Recording from a SIN in the Oh:GCaMP6s line with dendrites in superficial SO, preselected because of small-size-driven Ca2+ signals. (E–H) Current variance of cells shown in (A)–(D) as a function of target size. Horizontal lines indicate the mean variance for small and large targets, respectively. (I) Size index of SINs versus dendritic depth. Gray symbols indicate SINs randomly sampled in the pou4f3:GFP line (n = 41). Red, crossed circles indicate SINs preselected in the Oh:GCaMP6s line (nominal dendrite depth 100%, n = 7). The vertical line indicates 90% dendrite depth. (J) Size index of SINs with dendrites arborizing within 20%–90% of retinorecipient neuropil (SFGS) and e90% (SO) were significantly different (p = 3.5 × 10⁴, Wilcoxon rank-sum test). The red line indicates the median, the box indicates the 25%–75%-quartile range, and error bars indicate the full range of data. (K) Example of small-size-selective SIN in the Oh:GCaMP6s line. The same cell as in (D) is shown. The maximum-intensity projection is oriented as in Figure 3C. GCaMP6s expression shown in cyan. Scale bar, 40 µm. See also Figure S3. EXPRESSION / LABELING:
|
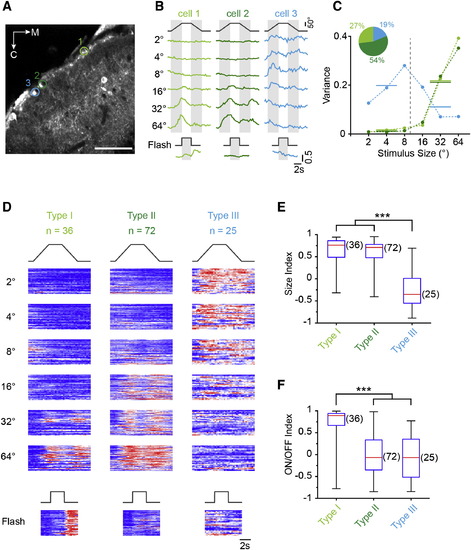
Size Tuning in Functionally Distinct Classes of SINs (A) Optical section representative of tectal expression in Oh:GCaMP6s fish. ROIs mark three SINs with fluorescence signals in response to moving targets. Scale bar, 40 µm. (B) Examples of fluorescence time course in ROIs shown in (A). The left and middle traces show the responses of large-size-selective SINs. Note difference in response to whole-field flash. On the right, the response of a small-size-selective SIN is shown. (C) Size-tuning curves of SINs shown in (A) and (B) (same color code) using variance analysis (Supplemental Experimental Procedures). The inset shows the proportion of each response type from all SINs (n = 133). (D) Raster plot of normalized fluorescence changes in response to stimuli of different sizes for the entire population, sorted using k-means clustering. Each row in the raster plot represents the fluorescence time course from an individual SIN soma. (E) Box-and-whisker plot of size indices for the three different response types of SINs shown in (D). Group III is statistically different (p = 3.6 × 10¹³, Kruskal-Wallis-test/Bonferroni correction for multiple comparisons). Red lines indicate the median, boxes indicate the 25%–75%-quartile range, and error bars indicate the full range of data. (F) Box-and-whisker plot of ON/OFF indices calculated from responses to whole-field stimuli for each of the three response types analyzed in (D). Group I is statistically different (p = 1.4 × 10¹⁰, Kruskal-Wallis-test with Bonferroni correction). See also Figure S4. EXPRESSION / LABELING:
|
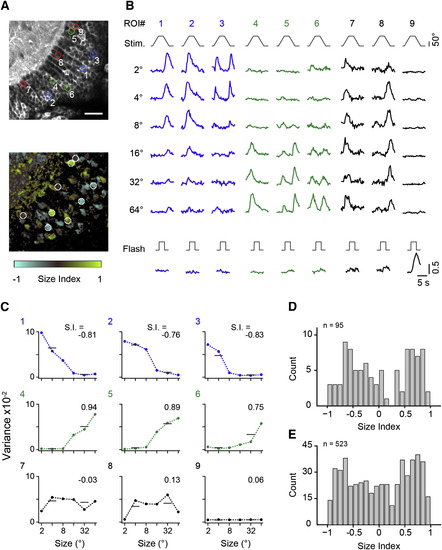
Large- and Small-Size-Selective Responses in Periventricular Neurons (A) Top: optical section through periventricular layer in elavl3:GCaMP5G fish. Bottom: size selectivity map for the same optical section, calculated from fluorescence signals in single pixels. Unresponsive pixels appear black, and responsive pixels insensitive to size appear gray (size index near 0). Examples of nine responsive PVNs are marked by circular ROIs. Scale bar, 20 µm. (B) Fluorescence time course in ROIs as indicated in (A) in response to moving targets and full-field flash. (C) Size-tuning curves calculated from signal variance in somatic ROIs indicated in (A). Size indices are indicated above the tuning curves. (D) Frequency histogram of size indices from cell bodies in a single fish from five optical sections. (E) Frequency histogram of size indices from cell body signals accumulated in five fish. |