
|
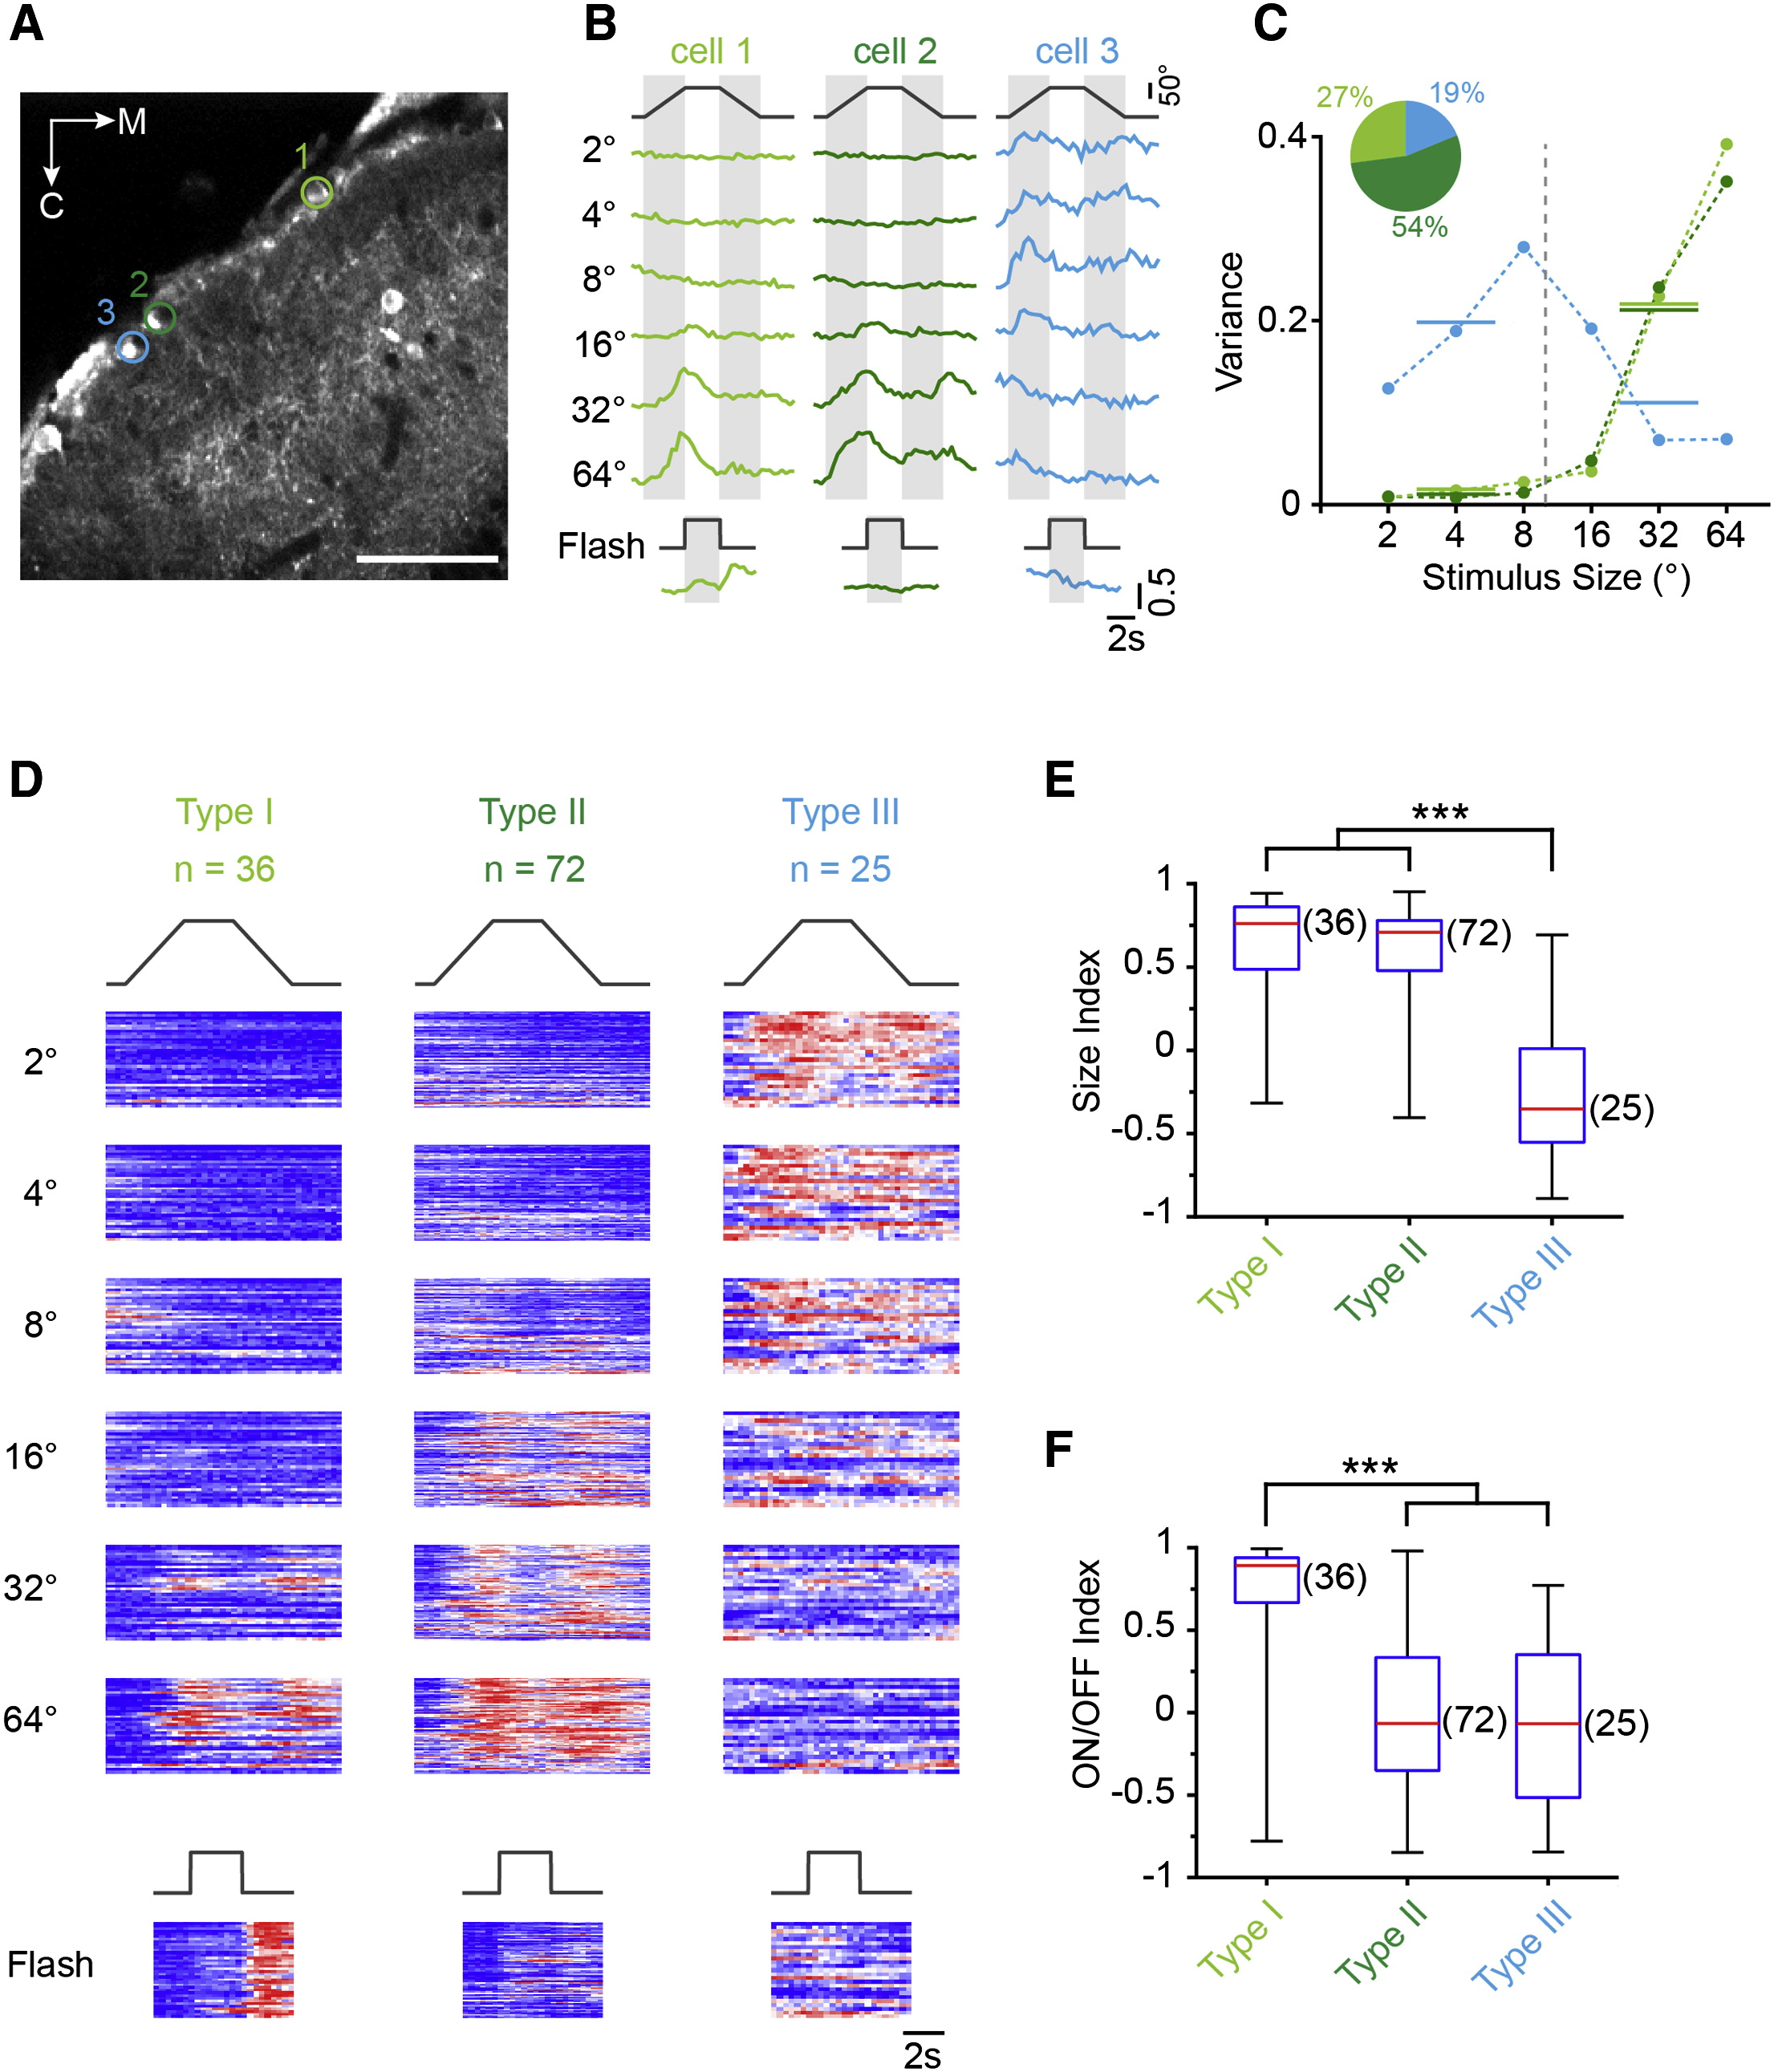
Fig. 5 Size Tuning in Functionally Distinct Classes of SINs (A) Optical section representative of tectal expression in Oh:GCaMP6s fish. ROIs mark three SINs with fluorescence signals in response to moving targets. Scale bar, 40 µm. (B) Examples of fluorescence time course in ROIs shown in (A). The left and middle traces show the responses of large-size-selective SINs. Note difference in response to whole-field flash. On the right, the response of a small-size-selective SIN is shown. (C) Size-tuning curves of SINs shown in (A) and (B) (same color code) using variance analysis (Supplemental Experimental Procedures). The inset shows the proportion of each response type from all SINs (n = 133). (D) Raster plot of normalized fluorescence changes in response to stimuli of different sizes for the entire population, sorted using k-means clustering. Each row in the raster plot represents the fluorescence time course from an individual SIN soma. (E) Box-and-whisker plot of size indices for the three different response types of SINs shown in (D). Group III is statistically different (p = 3.6 × 10¹³, Kruskal-Wallis-test/Bonferroni correction for multiple comparisons). Red lines indicate the median, boxes indicate the 25%–75%-quartile range, and error bars indicate the full range of data. (F) Box-and-whisker plot of ON/OFF indices calculated from responses to whole-field stimuli for each of the three response types analyzed in (D). Group I is statistically different (p = 1.4 × 10¹⁰, Kruskal-Wallis-test with Bonferroni correction). See also Figure S4.