
- Title
-
Disruptive CHD8 Mutations Define a Subtype of Autism Early in Development
- Authors
- Bernier, R., Golzio, C., Xiong, B., Stessman, H.A., Coe, B.P., Penn, O., Witherspoon, K., Gerdts, J., Baker, C., Vulto-van Silfhout, A.T., Schuurs-Hoeijmakers, J.H., Fichera, M., Bosco, P., Buono, S., Alberti, A., Failla, P., Peeters, H., Steyaert, J., Vissers, L.E., Francescatto, L., Mefford, H.C., Rosenfeld, J.A., Bakken, T., O'Roak, B.J., Pawlus, M., Moon, R., Shendure, J., Amaral, D.G., Lein, E., Rankin, J., Romano, C., de Vries, B.B., Katsanis, N., Eichler, E.E.
- Source
- Full text @ Cell
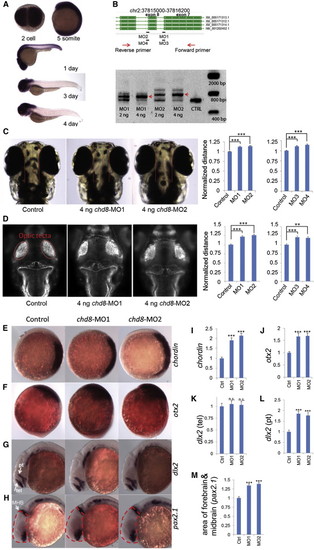
chd8 Disruption Results in Ectopic Expression of Forebrain/Midbrain Markers during Zebrafish Development In situ hybridization is shown for multiple markers before and after injection of chd8-MO1-4. (A) In situ hybridization of 2-cell, 5-somite, 1-, 3-, and 4-day stage zebrafish embryos using a 1.5 kbp chd8 antisense probe. chd8 is ubiquitously expressed in early stages; however, after day 1, its expression is enriched in the head region and the GI duct. (B) Two sets of morpholinos are independently designed to target two exon/intron junctions of chd8. To validate the morpholino effects, total mRNA was extracted at 24 hr postfertilization (hpf) followed by reverse transcription and PCR using primers flanking the targeted junctions. MO1 or MO2 injection leads to inclusion of the adjacent intron to mature mRNA. Red arrows indicate the PCR products of morpholino-modified chd8 transcripts. Uninjected AB strain embryos were used as control for all experiments in Figure 4. Data are represented as mean ± SEM. (C) The distance between the convex tips of the eyes was measured. MO1, MO2, MO3, and MO4 injection caused enlargement of this distance, and the results were quantified in the right panel. Data are represented as mean ± SEM. (D) Embryos were immunostained to highlight the neuronal axon tract in the developing brains. Embryos are imaged in dorsal view, and the optic tecta structure is indicated (red oval). The average distance between the optic tecta is measured and quantified (n = 50). Injection of chd8-MO1, MO2, MO3, and MO4 showed an enlargement of the distance consistent with interorbital distance measurements. Data are represented as mean ± SEM. (E and F) (E) Expression of chordin (marker of the dorsal organizing region) at shield stage, animal pole view, and dorsal oriented toward right. Chordin expression is expanded upon injection of chd8 morpholinos, and the overall staining intensity is quantified. (F) Orthodenticle homeobox 2 (otx2), an early marker of midbrain and forebrain neuronal progenitors. Expression of otx2 at tail bud stage, lateral view and dorsal oriented toward the right. Otx2 expression is enhanced upon injection of chd8 morpholinos and the overall staining intensity is quantified. (G and H) (G) Distal-less homeobox 2 (dlx2), a marker of neural stem cells. Expression of dlx2 at 24 hr stage, lateral view. Arrows point at the telencephalon (tel) region, and arrowhead points at the prethalamus (pt) region. dlx2 expression in the prethalamus, but not telencephalon, region is enhanced upon injection of chd8 morpholinos, as shown in (H) (pt) and (G) (tel), respectively. (H) Paired-box 2.1 (pax2.1), a marker of the midbrain/hindbrain boundary (MHB). Expression of pax2.1 at 24 hr stage, lateral view. Arrow points at MHB. The area of the head that contains the forebrain and midbrain is outlined by dashed red lines. The forebrain/midbrain region is enlarged upon injection of chd8 morpholinos, which is quantified. (I–M) Quantification of significant in situ hybridization results. n.s., not significant; p < 0.001; p < 0.0001. Data are represented as mean ± SEM. See also Figures S4, S5, and S6. |
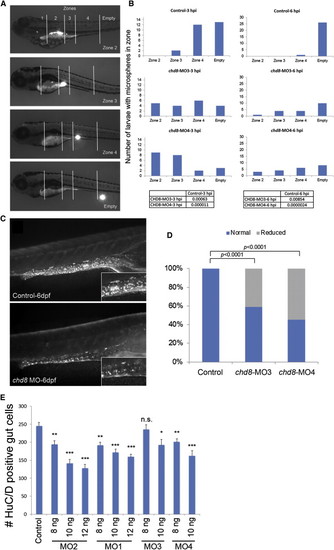
Analysis of GI Motility by Microgavage Assay (A) Example of intestinal transit within one larva over time. Intestinal zones are indicated in the top image (zones 1–4). Images below show fluorescent signal in the different intestinal zones outlined by white solid lines. (B) The most rostral location of microspheres was used to determine the transit zone scores. Bars represent the total number of larvae containing microspheres in each zone, and numbers at the top of each graph indicate the time elapsed after gavage (hours postinjection [hpi]). Numbers of larvae injected and scored are as follow: 27 sham-injected, 19 chd8-MO3-injected, and 22 chd8-MO4-injected. The microgavage experiment was repeated three times. Fisher’s exact test was performed; associated p values are shown in the corresponding tables. (C) Injection of chd8-MO leads to a reduced number of enteric neurons in the GI tract at 6 days postfertilization (dpf). Representative photographs (with HuC/D-antibody staining) show the lateral views of a sham-injected zebrafish larva (control) and a zebrafish larva injected with chd8 MO. Higher magnification of the GI tract, displayed in the insets, shows a reduced number of enteric neurons (labeled by anti-HuC/D antibody) in larvae injected with chd8 MOs compared to controls. (D) The bar graph represents the percentage of larvae (controls and injected with chd8-MO3 and -MO4) with reduced number of enteric neurons at 6 dpf. Corresponding p values are denoted on the bar graph (Pearson’s chi-square test). (E) Increasing the dosage of MO1-2 injection from 8 to 12 ng and MO3-4 from 8 to 10 ng resulted in a significant decrease in enteric neurons in the gut at 6 dpf measured by HuC/D-positive cells. n.s., not significant; p < 0.05; p < 0.001; p < 0.0001 (Student’s t test). Data are represented as mean ± SEM. |
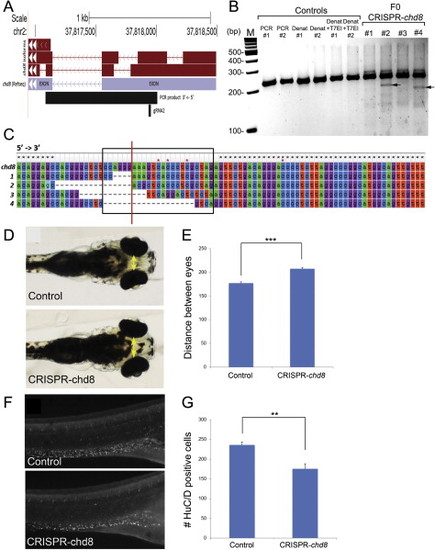
Chd8-CRISPR Zebrafish Embryos Phenocopy chd8 Morphant Phenotypes, Related to Figures 4 and 5 (A) Location of the guide RNA (gRNA) 2 used for zebrafish chd8-CRISPR experiments and PCR product for sequencing experiments in the context of chd8 gene structure. (B) At 5 dpf, a total of 26 founders and 30 controls were randomly selected and were subjected to T7 endonuclease I (T7EI) assay. Representative gel picture shows two controls and four founders subjected to T7EI assay. T7EI fragments are noted with black arrows for the positive founders #2 and #4. Lanes from left to right: M: 100 bp DNA ladder; PCR #1: PCR of exon2 of chd8 for control 1; PCR #2: PCR of exon2 of chd8 for control 2; DENAT #1: PCR of exon2 of chd8 after denaturation/reannealing for control 1; DENAT #2: PCR of exon2 of chd8 after denaturation/reannealing for control 2; DENAT+T7EI #1: PCR of exon2 of chd8 after denaturation/reannealing, and after T7EI digest for control 1; DENAT+T7EI #2: PCR of exon2 of chd8 after denaturation/reannealing, and after T7EI digest for control 2; F0 #1, #2, #3, #4: random selection of four embryos injected with chd8-gRNA2. We noted the presence of a T7EI fragment for a total of 13 out 26 founders subjected to T7EI assay, indicating that 50% of the founders have indels of exon 2 of chd8. No T7EI fragment was detected in the 30 controls tested. (C) Multiple sequence alignment of reference sequence (top) to four chd8-CRISPR variants generated from SMRT sequencing of the 920 base pair amplified product (Figure S5A). The black box indicates the sequence targeted by the guide RNA (gRNA2), and the red line marks the putative CRISPR cut site based on the location of the PAM recognition motif (i.e., CCA). Black stars indicated conserved residues, and red stars indicate positions of single base pair insertions present in the sequencing data. (D) 4.3 days after chd8-gRNA2 and nls-Cas9-nls co-injection, the distance between the convex tips of the eyes were measured (interorbital distance, yellow arrows). (E) Bar graph represents the distance between the eyes (µm) for controls and embryos injected with chd8-gRNA/Cas9. A Student’s t test was performed and the corresponding p value is denoted on the bar graph. p < 0.0001. (F) 6 days after chd8-gRNA2 and nls-Cas9-nls co-injection, the embryos were stained with HuC/D antibody, imaged and the number of enteric neurons was quantified utilizing ImageJ. (G) Quantification of the number of HuC/D positive cells in the GI tract in controls and embryos injected with chd8-gRNA/Cas9. A Student’s t test was performed and the corresponding p value is denoted on the bar graph. p < 0.001. |
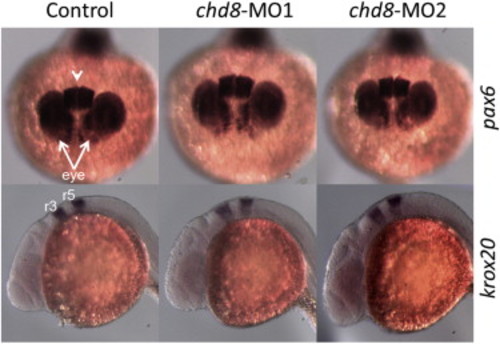
Additional Marker Analyses in chd8 Morphants, Related to Figure 4 Embryos were injected with 4 ng of chd8-MO1 or 4 ng chd8-MO2. Paired-box 6 (pax6) is a marker of the eye region and the telencephalon. Expression of pax6 at 24 hr stage, top view. Arrows point at the eye region and arrowhead points at the telencephalon region. No significant change is observed for pax6 expression (top panels). Expression of krox20 at 24 hr stage, lateral view. Rhombomere 3 (r3) and 5 (r5) of the hindbrain is labeled. No significant change is observed (bottom panels). |
Reprinted from Cell, 158(2), Bernier, R., Golzio, C., Xiong, B., Stessman, H.A., Coe, B.P., Penn, O., Witherspoon, K., Gerdts, J., Baker, C., Vulto-van Silfhout, A.T., Schuurs-Hoeijmakers, J.H., Fichera, M., Bosco, P., Buono, S., Alberti, A., Failla, P., Peeters, H., Steyaert, J., Vissers, L.E., Francescatto, L., Mefford, H.C., Rosenfeld, J.A., Bakken, T., O'Roak, B.J., Pawlus, M., Moon, R., Shendure, J., Amaral, D.G., Lein, E., Rankin, J., Romano, C., de Vries, B.B., Katsanis, N., Eichler, E.E., Disruptive CHD8 Mutations Define a Subtype of Autism Early in Development, 263-76, Copyright (2014) with permission from Elsevier. Full text @ Cell