
Fig. 5
- ID
- ZDB-FIG-141006-21
- Publication
- Bernier et al., 2014 - Disruptive CHD8 Mutations Define a Subtype of Autism Early in Development
- Other Figures
- All Figure Page
- Back to All Figure Page
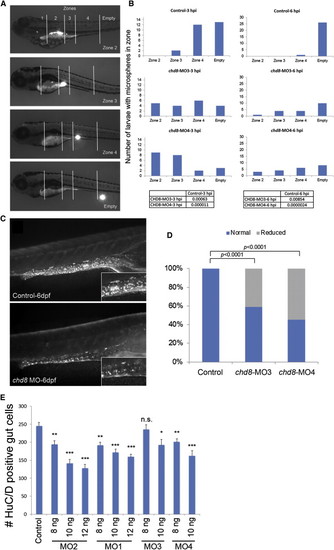
Analysis of GI Motility by Microgavage Assay (A) Example of intestinal transit within one larva over time. Intestinal zones are indicated in the top image (zones 1–4). Images below show fluorescent signal in the different intestinal zones outlined by white solid lines. (B) The most rostral location of microspheres was used to determine the transit zone scores. Bars represent the total number of larvae containing microspheres in each zone, and numbers at the top of each graph indicate the time elapsed after gavage (hours postinjection [hpi]). Numbers of larvae injected and scored are as follow: 27 sham-injected, 19 chd8-MO3-injected, and 22 chd8-MO4-injected. The microgavage experiment was repeated three times. Fisher’s exact test was performed; associated p values are shown in the corresponding tables. (C) Injection of chd8-MO leads to a reduced number of enteric neurons in the GI tract at 6 days postfertilization (dpf). Representative photographs (with HuC/D-antibody staining) show the lateral views of a sham-injected zebrafish larva (control) and a zebrafish larva injected with chd8 MO. Higher magnification of the GI tract, displayed in the insets, shows a reduced number of enteric neurons (labeled by anti-HuC/D antibody) in larvae injected with chd8 MOs compared to controls. (D) The bar graph represents the percentage of larvae (controls and injected with chd8-MO3 and -MO4) with reduced number of enteric neurons at 6 dpf. Corresponding p values are denoted on the bar graph (Pearson’s chi-square test). (E) Increasing the dosage of MO1-2 injection from 8 to 12 ng and MO3-4 from 8 to 10 ng resulted in a significant decrease in enteric neurons in the gut at 6 dpf measured by HuC/D-positive cells. n.s., not significant; p < 0.05; p < 0.001; p < 0.0001 (Student’s t test). Data are represented as mean ± SEM. |
| Antibody: | |
|---|---|
| Fish: | |
| Knockdown Reagents: | |
| Anatomical Term: | |
| Stage: | Day 6 |
| Fish: | |
|---|---|
| Knockdown Reagents: | |
| Observed In: | |
| Stage: | Day 6 |
Reprinted from Cell, 158(2), Bernier, R., Golzio, C., Xiong, B., Stessman, H.A., Coe, B.P., Penn, O., Witherspoon, K., Gerdts, J., Baker, C., Vulto-van Silfhout, A.T., Schuurs-Hoeijmakers, J.H., Fichera, M., Bosco, P., Buono, S., Alberti, A., Failla, P., Peeters, H., Steyaert, J., Vissers, L.E., Francescatto, L., Mefford, H.C., Rosenfeld, J.A., Bakken, T., O'Roak, B.J., Pawlus, M., Moon, R., Shendure, J., Amaral, D.G., Lein, E., Rankin, J., Romano, C., de Vries, B.B., Katsanis, N., Eichler, E.E., Disruptive CHD8 Mutations Define a Subtype of Autism Early in Development, 263-76, Copyright (2014) with permission from Elsevier. Full text @ Cell