
Fig. S5
- ID
- ZDB-FIG-141006-19
- Publication
- Bernier et al., 2014 - Disruptive CHD8 Mutations Define a Subtype of Autism Early in Development
- Other Figures
- All Figure Page
- Back to All Figure Page
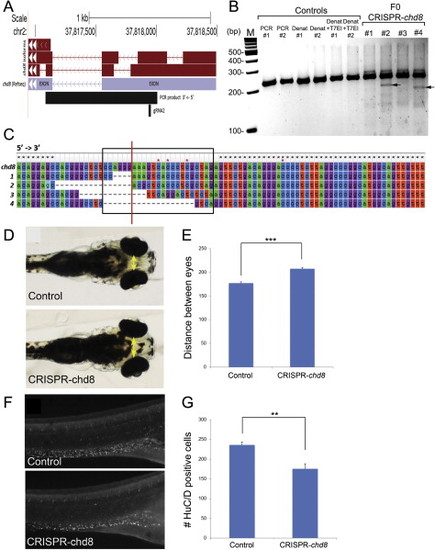
Chd8-CRISPR Zebrafish Embryos Phenocopy chd8 Morphant Phenotypes, Related to Figures 4 and 5 (A) Location of the guide RNA (gRNA) 2 used for zebrafish chd8-CRISPR experiments and PCR product for sequencing experiments in the context of chd8 gene structure. (B) At 5 dpf, a total of 26 founders and 30 controls were randomly selected and were subjected to T7 endonuclease I (T7EI) assay. Representative gel picture shows two controls and four founders subjected to T7EI assay. T7EI fragments are noted with black arrows for the positive founders #2 and #4. Lanes from left to right: M: 100 bp DNA ladder; PCR #1: PCR of exon2 of chd8 for control 1; PCR #2: PCR of exon2 of chd8 for control 2; DENAT #1: PCR of exon2 of chd8 after denaturation/reannealing for control 1; DENAT #2: PCR of exon2 of chd8 after denaturation/reannealing for control 2; DENAT+T7EI #1: PCR of exon2 of chd8 after denaturation/reannealing, and after T7EI digest for control 1; DENAT+T7EI #2: PCR of exon2 of chd8 after denaturation/reannealing, and after T7EI digest for control 2; F0 #1, #2, #3, #4: random selection of four embryos injected with chd8-gRNA2. We noted the presence of a T7EI fragment for a total of 13 out 26 founders subjected to T7EI assay, indicating that 50% of the founders have indels of exon 2 of chd8. No T7EI fragment was detected in the 30 controls tested. (C) Multiple sequence alignment of reference sequence (top) to four chd8-CRISPR variants generated from SMRT sequencing of the 920 base pair amplified product (Figure S5A). The black box indicates the sequence targeted by the guide RNA (gRNA2), and the red line marks the putative CRISPR cut site based on the location of the PAM recognition motif (i.e., CCA). Black stars indicated conserved residues, and red stars indicate positions of single base pair insertions present in the sequencing data. (D) 4.3 days after chd8-gRNA2 and nls-Cas9-nls co-injection, the distance between the convex tips of the eyes were measured (interorbital distance, yellow arrows). (E) Bar graph represents the distance between the eyes (µm) for controls and embryos injected with chd8-gRNA/Cas9. A Student’s t test was performed and the corresponding p value is denoted on the bar graph. p < 0.0001. (F) 6 days after chd8-gRNA2 and nls-Cas9-nls co-injection, the embryos were stained with HuC/D antibody, imaged and the number of enteric neurons was quantified utilizing ImageJ. (G) Quantification of the number of HuC/D positive cells in the GI tract in controls and embryos injected with chd8-gRNA/Cas9. A Student’s t test was performed and the corresponding p value is denoted on the bar graph. p < 0.001. |
| Antibody: | |
|---|---|
| Fish: | |
| Knockdown Reagent: | |
| Anatomical Term: | |
| Stage: | Day 6 |
| Fish: | |
|---|---|
| Knockdown Reagent: | |
| Observed In: | |
| Stage Range: | Day 4 to Day 6 |
Reprinted from Cell, 158(2), Bernier, R., Golzio, C., Xiong, B., Stessman, H.A., Coe, B.P., Penn, O., Witherspoon, K., Gerdts, J., Baker, C., Vulto-van Silfhout, A.T., Schuurs-Hoeijmakers, J.H., Fichera, M., Bosco, P., Buono, S., Alberti, A., Failla, P., Peeters, H., Steyaert, J., Vissers, L.E., Francescatto, L., Mefford, H.C., Rosenfeld, J.A., Bakken, T., O'Roak, B.J., Pawlus, M., Moon, R., Shendure, J., Amaral, D.G., Lein, E., Rankin, J., Romano, C., de Vries, B.B., Katsanis, N., Eichler, E.E., Disruptive CHD8 Mutations Define a Subtype of Autism Early in Development, 263-76, Copyright (2014) with permission from Elsevier. Full text @ Cell