
- Title
-
Cadherin 6 promotes neural crest cell detachment via F-actin regulation and influences active Rho distribution during epithelial-to-mesenchymal transition
- Authors
- Clay, M.R., Halloran, M.C.
- Source
- Full text @ Development
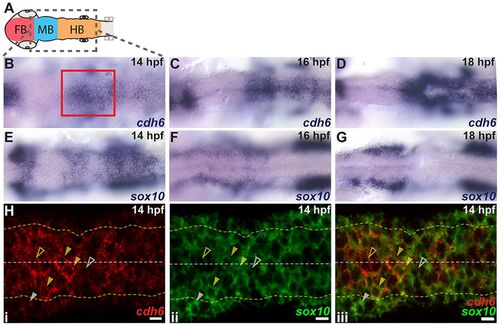
cdh6 is expressed dynamically in the hindbrain and NCCs. (A) Embryonic brain divisions. Gray box shows region displayed in B-G. (B-G) Dorsal views (anterior left) of cdh6 and sox10 in situ hybridizations at 14hpf (B,E), 16hpf (C,F) and 18hpf (D,G). Red box marks approximate area shown in H. (H) Confocal images (dorsal views, anterior left, individual z-planes) of fluorescent in situ hybridizations for cdh6 (i, iii) and sox10 (ii, iii) at 14hpf. Yellow dashed lines mark basal neuroepithelial surfaces and white dashed lines mark apical midlines. Cells between the yellow dashed lines are neuroepithelial cells or premigratory NCCs. Cells outside the yellow dashed lines are mesenchymal cells or delaminated NCCs. Closed yellow arrowheads mark premigratory NCCs expressing cdh6 and sox10. Open yellow arrowheads mark neuroepithelial cells expressing only cdh6. Open white arrowheads mark NCCs expressing only sox10. Closed white arrowheads mark NCCs outside the neuroepithelium expressing only sox10. FB, forebrain; MB, midbrain; HB, hindbrain. Scale bars: 10μm. |
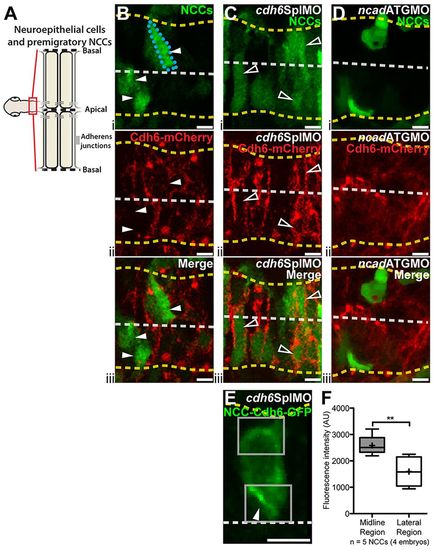
Exogenous Cdh6 distribution is tightly regulated. (A) Imaging region and neuroepithelial structure. (B-E) Confocal images (dorsal views, anterior left) of living 14hpf embryos injected with cdh6-mCherry mRNA (B-D) or 4.9sox10:GFP (E). Yellow dashed lines mark basal neuroepithelial surfaces and white dashed lines mark apical midlines. (B-D) Single confocal z-planes showing Cdh6-mCherry (ii, iii) in transgenic embryos with GFP-labeled NCCs (i, iii). (B) Cdh6-mCherry is rarely seen in NCCs (arrowheads and outlined NCC) after cdh6-mCherry mRNA injection alone. (C) More NCCs express Cdh6-mCherry (open arrowheads) after cdh6SplMO injection. (D) Few NCCs express Cdh6-mCherry with Ncad knockdown (ncadATGMO). (E) Confocal z-projection of Cdh6-GFP in a premigratory NCC. Boxes show ROIs measured. (F) Cdh6-GFP intensity is elevated in midline regions relative to lateral regions of NCCs (**P=0.0056, unpaired one-tailed t-test). AU, arbitrary units. Line is median, + is mean, box covers upper and lower quartiles, and bars encompass minimum and maximum values. Scale bars: 10μm. |
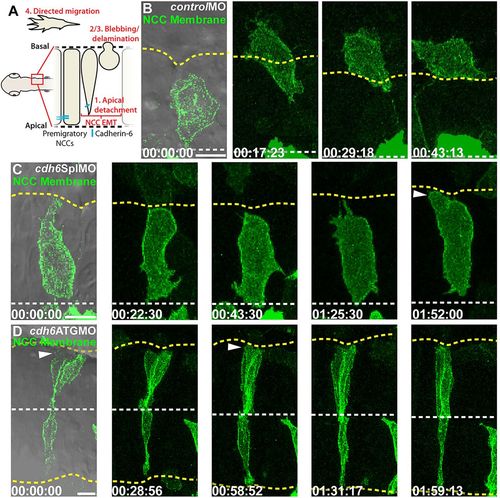
Cdh6 knockdown reduces NCC detachment and EMT. (A) NCC EMT behaviors and imaging region. (B-D) Time-lapse images (dorsal views, anterior left, confocal z-projections, beginning at 14hpf) of NCCs expressing GFP-CAAX. First frames show a single DIC plane for reference. Yellow dashed lines mark basal neuroepithelial surfaces and white dashed lines mark apical midlines. (B) Control morpholino (controlMO) injection does not affect NCC behaviors or EMT. (C,D) Cdh6 knockdown with cdh6SplMO (B) or cdh6ATGMO (C) disrupts apical detachment and EMT. However, NCCs do exhibit blebbing (arrowheads). Time=h:min:s. Scale bars: 10 μm. |
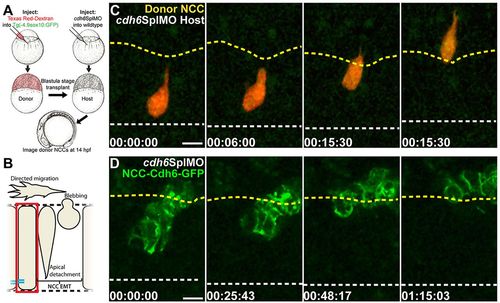
Cdh6 function in EMT is NCC autonomous and Cdh6-GFP rescues morpholino knockdown. (A) Cell transplantation experiments. (B) Imaging region in C,D. (C,D) Confocal z-projections (dorsal views, anterior left) showing NCCs that were in the neuroepithelium at imaging onset. Time-lapse imaging began at 14hpf. Yellow dashed lines mark basal neuroepithelial surfaces and white dashed lines mark apical midlines. (C) A wild-type donor NCC (red/green) undergoes EMT normally when transplanted into a Cdh6 knockdown embryo. (D) NCCs expressing Cdh6-GFP undergo EMT as a cluster in Cdh6 knockdown embryo. Time=h:min:s. Scale bars: 10μm. |
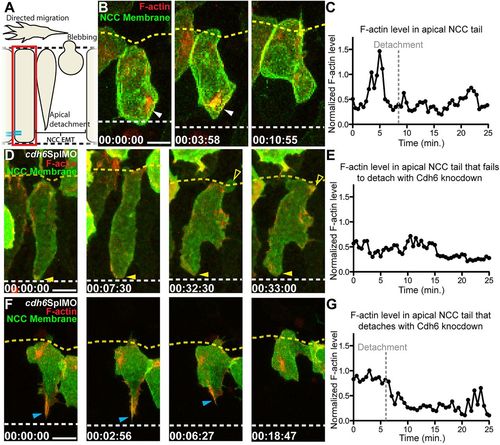
Cdh6 is important for apical F-actin accumulation during NCC detachment. (A) Overview of imaging region. (B,D,F) Time-lapse images (dorsal views, anterior left, confocal z-projections beginning at 14hpf) of NCCs expressing GFP-CAAX and F-actin biosensor (red). Yellow dashed lines mark basal neuroepithelial surfaces and white dashed lines mark apical midlines. (C,E,G) Plots of normalized F-actin intensity in apical tail over time. (B) In a control embryo, apical detachment is preceded by F-actin accumulation (white arrowheads). (C) Intensity of apical tail F-actin peaks prior to detachment in wild-type NCC shown in B. (D) After Cdh6 knockdown, F-actin does not accumulate in the apical tail (closed yellow arrowheads), the tail does not detach and the NCC does not undergo EMT. (E) Intensity of apical F-actin remains low in the Cdh6-knockdown NCC shown in B. (F) In a Cdh6-knockdown NCC that does detach and undergo EMT, F-actin accumulates apically before detachment (blue arrowheads). (G) Intensity of apical F-actin peaks before detachment in the Cdh6-knockdown NCC shown in F. Time=h:min:s. Scale bars: 10 μm. |
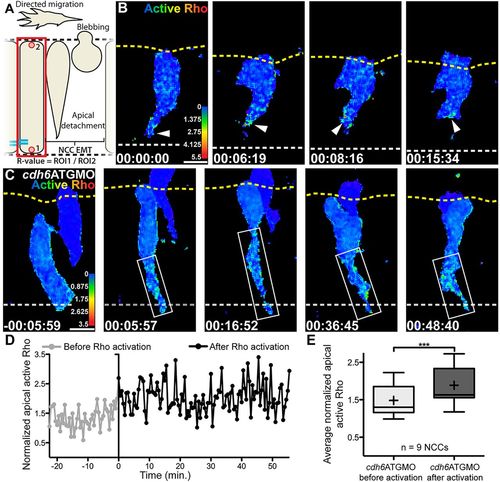
Cdh6 knockdown expands area of Rho activation. (A) Overview of imaging region and definition of normalized active Rho measure (R-value). (B,C) Time-lapse images (dorsal views, anterior left, confocal z-projections beginning at 14hpf) of NCCs expressing active Rho biosensor. Yellow dashed lines mark basal neuroepithelial surfaces and white dashed lines mark apical midlines. (B) In a control embryo, active Rho is observed primarily near the midline during NCC tail detachment (arrowheads). (C) In a Cdh6-knockdown embryo, Rho is activated but area of activation is expanded (boxes). (D) Active Rho level (R-value) over time in tail of NCC shown in C. Time when Rho activation is observed is 0min in C,D. (E) Average active Rho level (n=9 NCCs) becomes elevated in Cdh6-knockdown embryos (***P=0.0009, paired two tailed t-test). Line is median,+is mean, box covers upper and lower quartiles, and bars encompass minimum and maximum values. Time=h:min:s. Scale bars: 10 μm. |
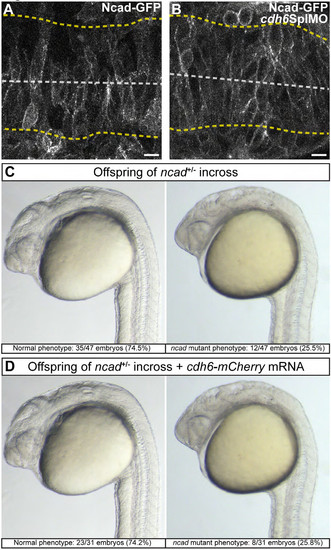
Cdh6 does not modulate Ncad-GFP and cannot compensate for Ncad loss. (A, B) Individual confocal z-planes (dorsal views, anterior left) of living 14 hpf embryos injected with ncad-gfp mRNA. (A) Ncad-GFP is localized to the cell membrane and enriched in many apical neuroepithelium cell regions. (B) Cdh6 knockdown (cdh6SplMO) does not alter Ncad-GFP localization. (C, D) Examples of normal and ncad mutant phenotypes in offspring of ncadtm101+/- adults. Embryos were uninjected (C) or injected with cdh6-mcherry mRNA (D). Cdh6-mCherry does not resuce Ncad mutation. |