
|
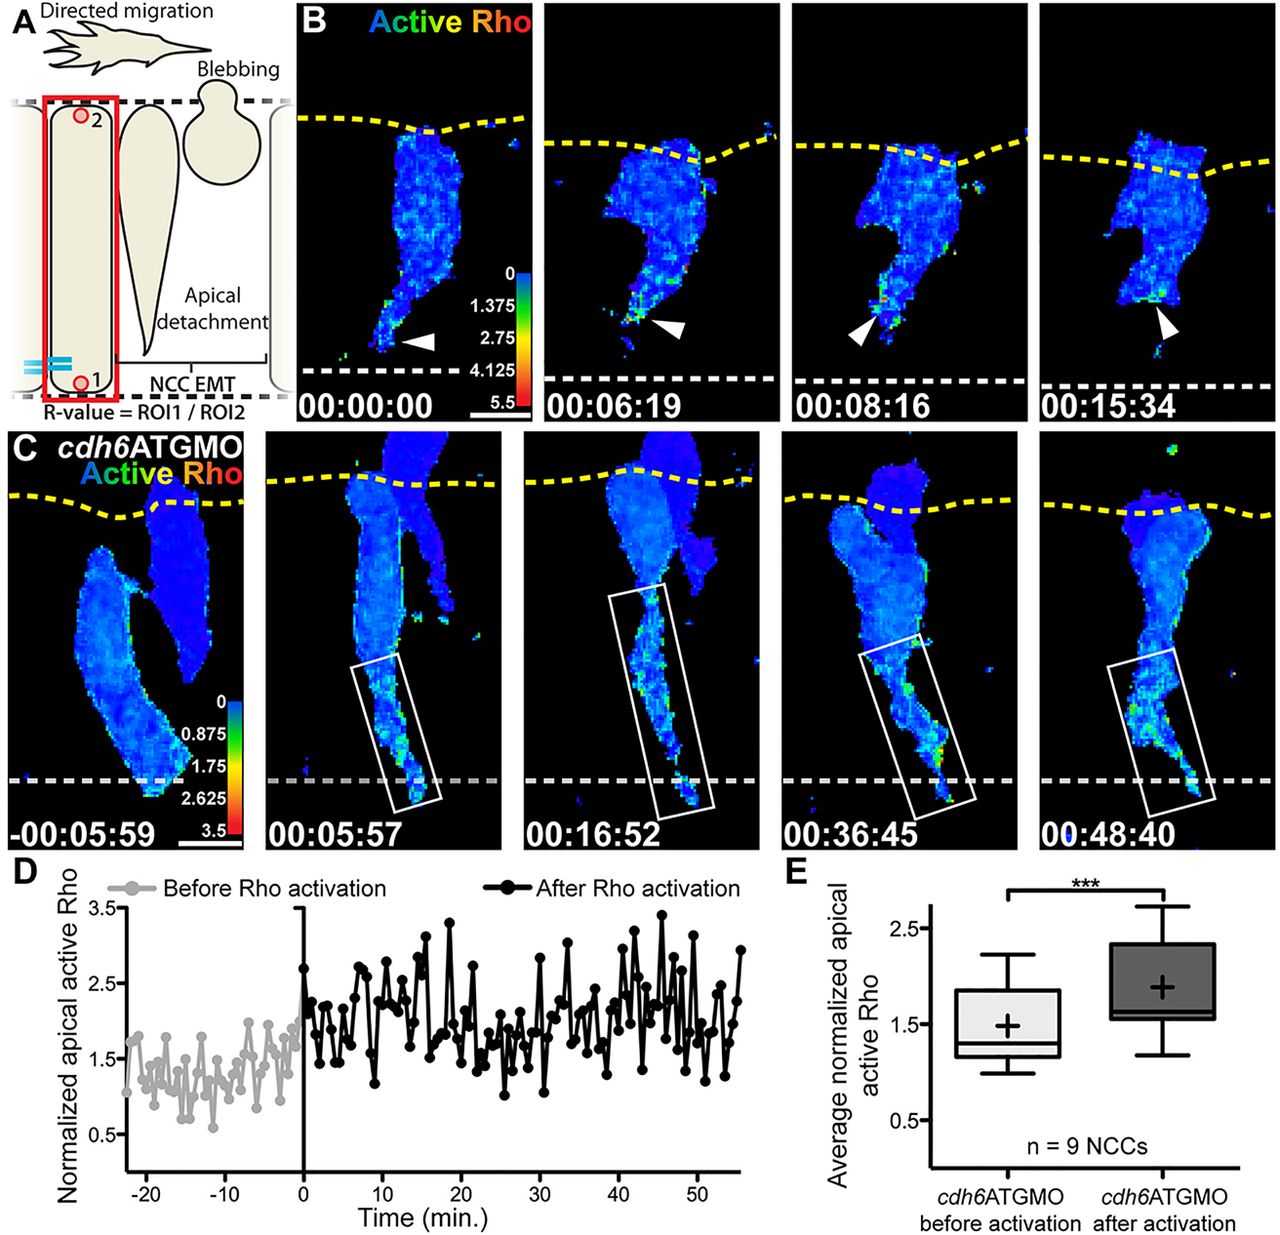
Fig. 6
Cdh6 knockdown expands area of Rho activation. (A) Overview of imaging region and definition of normalized active Rho measure (R-value). (B,C) Time-lapse images (dorsal views, anterior left, confocal z-projections beginning at 14hpf) of NCCs expressing active Rho biosensor. Yellow dashed lines mark basal neuroepithelial surfaces and white dashed lines mark apical midlines. (B) In a control embryo, active Rho is observed primarily near the midline during NCC tail detachment (arrowheads). (C) In a Cdh6-knockdown embryo, Rho is activated but area of activation is expanded (boxes). (D) Active Rho level (R-value) over time in tail of NCC shown in C. Time when Rho activation is observed is 0min in C,D. (E) Average active Rho level (n=9 NCCs) becomes elevated in Cdh6-knockdown embryos (***P=0.0009, paired two tailed t-test). Line is median,+is mean, box covers upper and lower quartiles, and bars encompass minimum and maximum values. Time=h:min:s. Scale bars: 10 μm.