
|
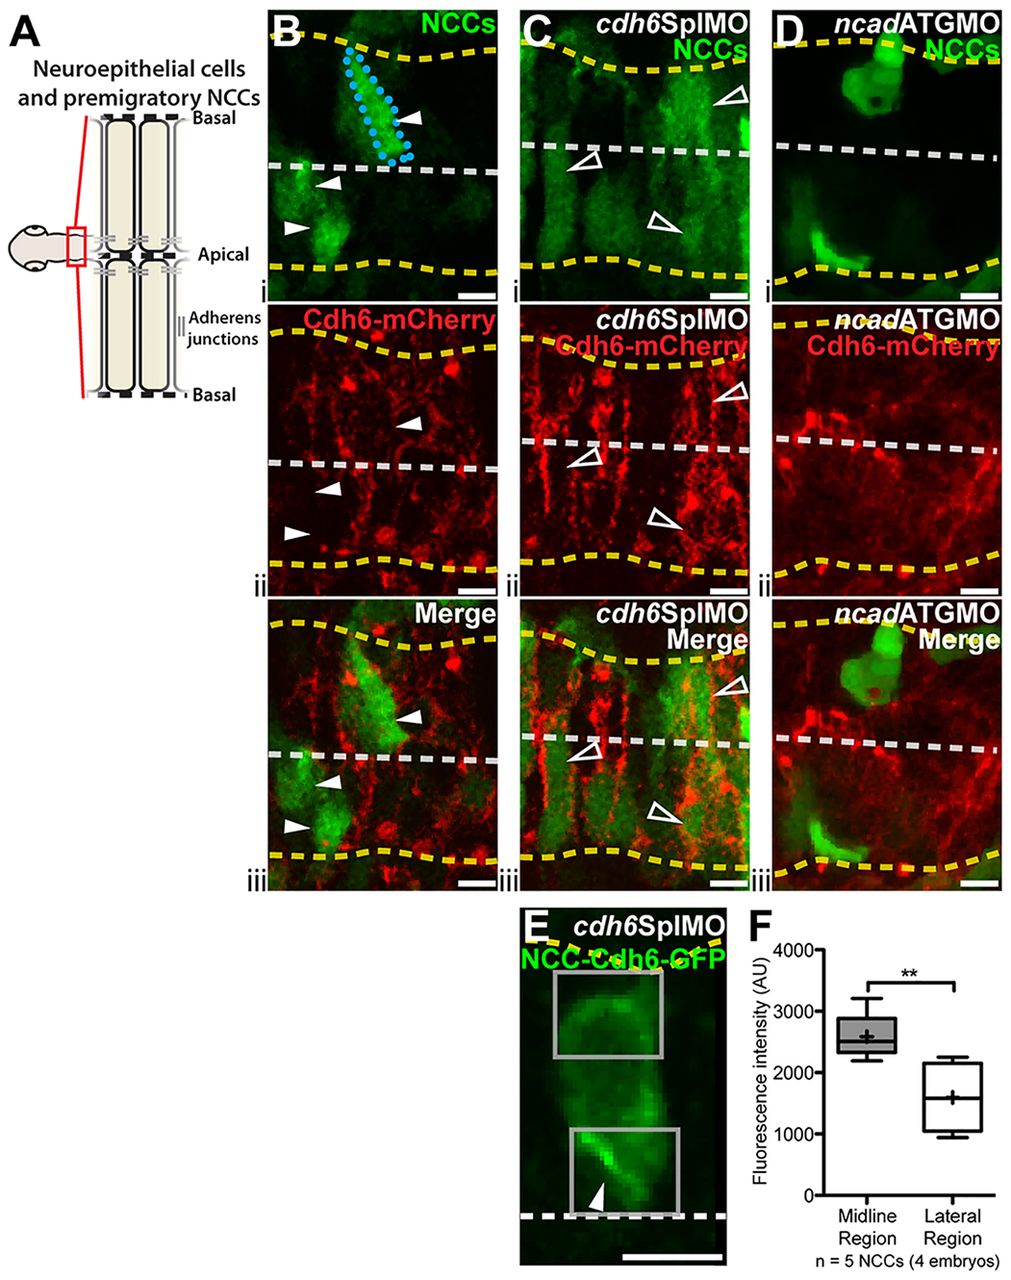
Fig. 2
Exogenous Cdh6 distribution is tightly regulated. (A) Imaging region and neuroepithelial structure. (B-E) Confocal images (dorsal views, anterior left) of living 14hpf embryos injected with cdh6-mCherry mRNA (B-D) or 4.9sox10:GFP (E). Yellow dashed lines mark basal neuroepithelial surfaces and white dashed lines mark apical midlines. (B-D) Single confocal z-planes showing Cdh6-mCherry (ii, iii) in transgenic embryos with GFP-labeled NCCs (i, iii). (B) Cdh6-mCherry is rarely seen in NCCs (arrowheads and outlined NCC) after cdh6-mCherry mRNA injection alone. (C) More NCCs express Cdh6-mCherry (open arrowheads) after cdh6SplMO injection. (D) Few NCCs express Cdh6-mCherry with Ncad knockdown (ncadATGMO). (E) Confocal z-projection of Cdh6-GFP in a premigratory NCC. Boxes show ROIs measured. (F) Cdh6-GFP intensity is elevated in midline regions relative to lateral regions of NCCs (**P=0.0056, unpaired one-tailed t-test). AU, arbitrary units. Line is median, + is mean, box covers upper and lower quartiles, and bars encompass minimum and maximum values. Scale bars: 10μm.