
|
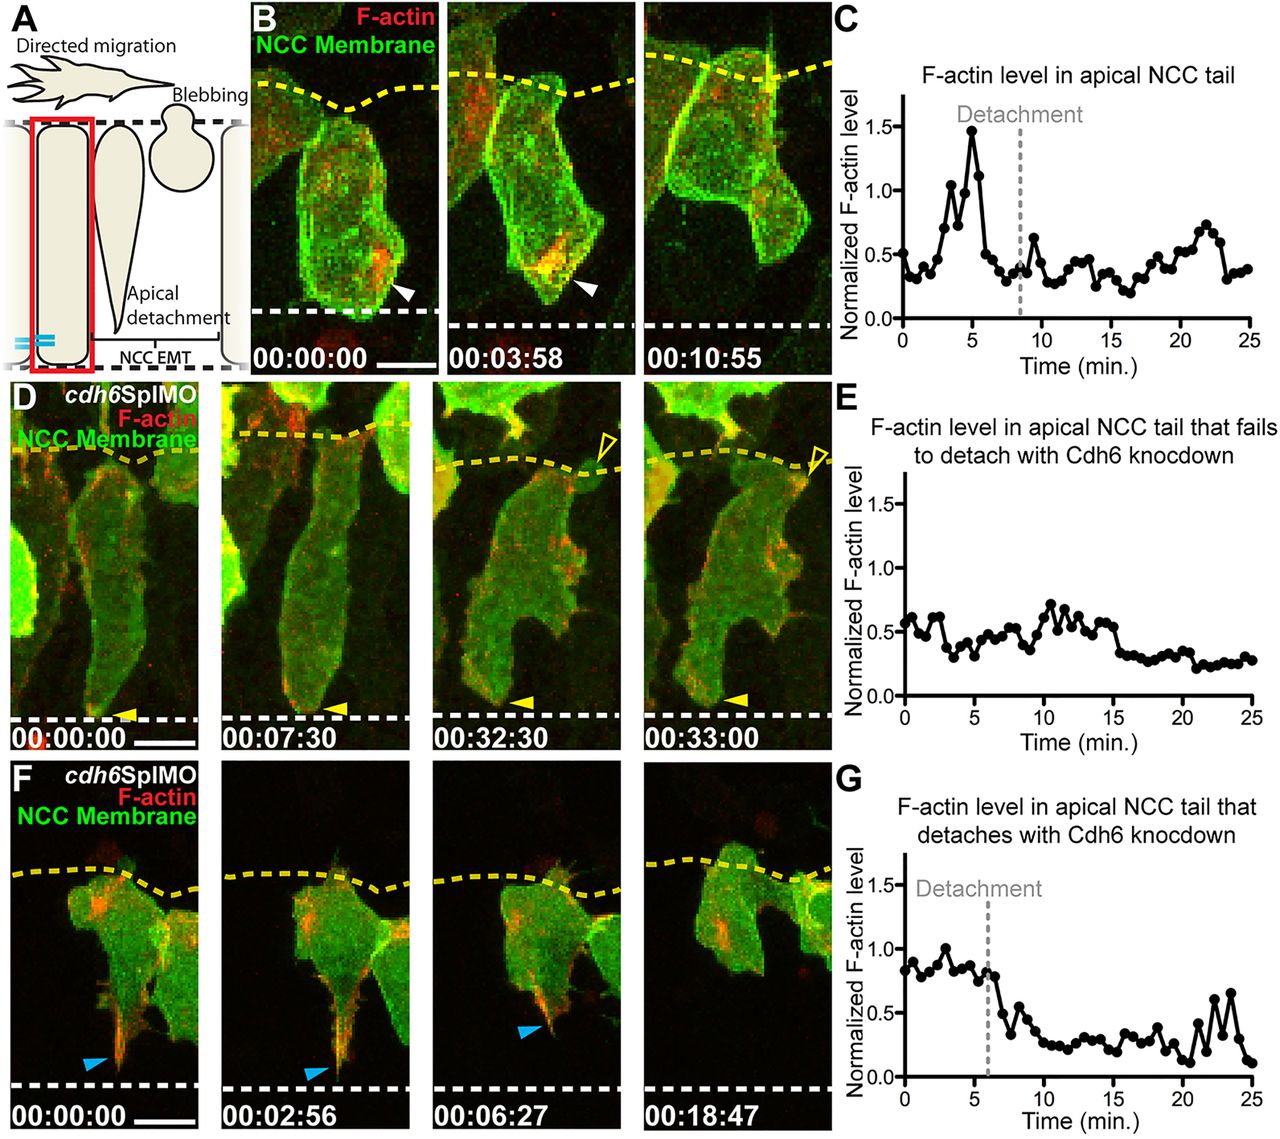
Fig. 5
Cdh6 is important for apical F-actin accumulation during NCC detachment. (A) Overview of imaging region. (B,D,F) Time-lapse images (dorsal views, anterior left, confocal z-projections beginning at 14hpf) of NCCs expressing GFP-CAAX and F-actin biosensor (red). Yellow dashed lines mark basal neuroepithelial surfaces and white dashed lines mark apical midlines. (C,E,G) Plots of normalized F-actin intensity in apical tail over time. (B) In a control embryo, apical detachment is preceded by F-actin accumulation (white arrowheads). (C) Intensity of apical tail F-actin peaks prior to detachment in wild-type NCC shown in B. (D) After Cdh6 knockdown, F-actin does not accumulate in the apical tail (closed yellow arrowheads), the tail does not detach and the NCC does not undergo EMT. (E) Intensity of apical F-actin remains low in the Cdh6-knockdown NCC shown in B. (F) In a Cdh6-knockdown NCC that does detach and undergo EMT, F-actin accumulates apically before detachment (blue arrowheads). (G) Intensity of apical F-actin peaks before detachment in the Cdh6-knockdown NCC shown in F. Time=h:min:s. Scale bars: 10 μm.