
- Title
-
Generation and Dynamics of an Endogenous, Self-Generated Signaling Gradient across a Migrating Tissue
- Authors
- Venkiteswaran, G., Lewellis, S.W., Wang, J., Reynolds, E., Nicholson, C., and Knaut, H.
- Source
- Full text @ Cell
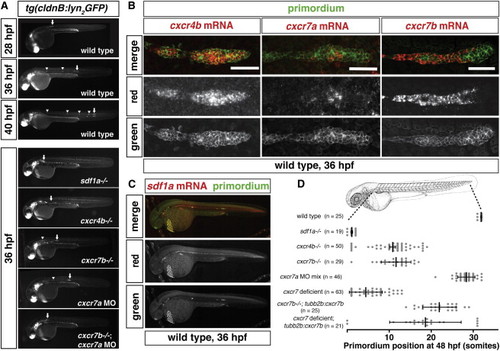
Expression and Requirement of Sdf1a and Its Receptors Cxcr4b, Cxcr7a, and Cxcr7b during Primordium Migration (A) Live images of embryos of the indicated stage and genotype. Arrow indicates the primordium, and arrowheads indicate neuromasts. (B) Fluorescent staining for cxcr4b, cxcr7a, or cxcr7b mRNA and GFP protein at 36 hpf. Scale bar, 50 μm. (C) Fluorescent staining for sdf1a mRNA and GFP protein in a tg(cldnB:lyn2GFP) embryo at 36 hpf. Anterior is to the left, and posterior is to the right. (D) Quantification of primordium migration in 48 hpf embryos of indicated genotypes. The vertical bars represent the average position of the primordium, the error bars represent SD, and the circles represent the positions of individual primordia. 48 hpf embryo schematic adapted from (Kimmel et al., 1995). See also Figure S6. |
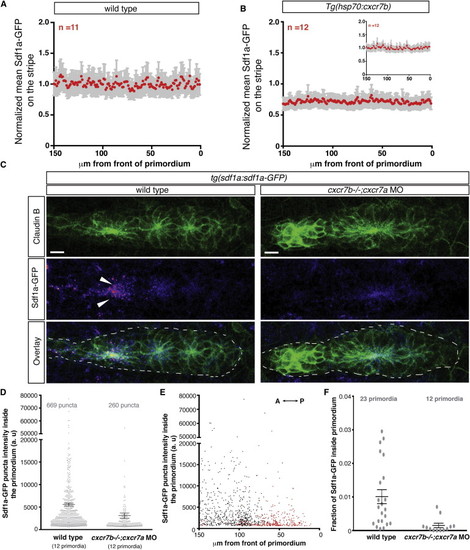
Cxcr7 Is Required for Sdf1a-GFP Sequestration by the Primordium (A and B) Average fluorescence intensity of Sdf1a-GFP protein along the stripe of chemokine-producing cells underneath primordia in embryos of indicated genotypes (B, inset, heat-shocked wild-type control embryos). (C) Sum projection of the primordium from 36 hpf embryos of indicated genotypes stained for Claudin-B and GFP. Scale bar, 10 μm. Direction of migration is to the right. Arrowheads indicate Sdf1a-GFP puncta. (D) Distribution of intensities of Sdf1a-GFP puncta in primordia of indicated genotypes. (E) Distribution of intensities of Sdf1a-GFP puncta in primordia along the anterior-posterior axis. Each dot (D and E) represents an individual punctum (red, cxcr7b/; cxcr7a morphant primordia; black, wild-type primordia). (F) Fraction of Sdf1a-GFP found inside of the primordium of the total Sdf1a-GFP in the indicated genotype. Each dot represents the fraction of Sdf1a-GFP in an individual primordium. Horizontal bars represent the mean ± SEM. See also Figure S1 and Data S1 and S2. EXPRESSION / LABELING:
|
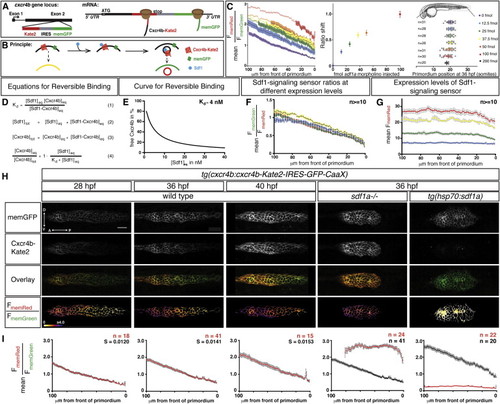
A Quantitative Signaling Reporter for Sdf1 (A and B) Schematic of Sdf1-signaling sensor construct (A) and concept (B). (C) (Left) Mean FmemRed/FmemGreen ratio along the anterior-posterior axis of n e 20 primordia from tg(cxcr4b:cxcr4b-Kate2-IRES-GFP-CaaX) embryos injected with sdf1a morpholino. Circles are mean ratios, and error bars represent SEM. Open circles indicate ratios greater than the SD corrected mean FmemRed/FmemGreen ratio in sdf1a/ primordia. (Middle) Shift of the FmemRed/FmemGreen ratio curves on left. The error bars represent SD. (Right) Primordium position in embryos injected with increasing amounts of sdf1a morpholino. The vertical bars represent the average position of the primordium, the error bars represent SD, and the circles represent the positions of individual primordia. 35 hpf embryo schematic adapted from Kimmel et al., (1995). (D) Derivation of equation for reversible binding of Sdf1 to Cxcr4b (Equation 4) using the definition of the dissociation constant (Equation 1) for the reversible reaction Cxcr4beq+Sdf1eq Ì Cxcr4b-Sdf1eq (wherein Cxcr4beq is free receptor, Sdf1eq is free ligand, and Cxcr4b-Sdf1eq is receptor-ligand complex) and mass balance for Sdf1 (Equation 2) and Cxcr4b (Equation 3). (E) Graph of Equation 4 for a Kd of 4 nM (Crump et al., 1997). (F) Mean FmemGreen/FmemRed ratio values across 100 μm beginning at the front of the primordium in 36 hpf wild-type embryos with increasing levels of expression of the signaling sensor indicated in (G). (G) Mean FmemRed intensity values across 100 µm beginning at the front of the primordium in 36 hpf embryos carrying different combinations and copy numbers of the signaling sensor transgenes (blue, Sdf1 sensorGRp1/+, n = 14; green, Sdf1 sensorGRp7/+, n = 17; yellow, Sdf1 sensorGRp1/ Sdf1 sensorGRp7, n = 10; red, Sdf1 sensorGRp7/ Sdf1 sensorGRp7, n = 16). The colored and gray bars indicate SEM in (F) and (G), respectively. (H) Single confocal slices through the primordium in live embryos of the indicated genotypes and stages, all carrying the Sdf1-signaling sensor. The FmemRed/FmemGreen images are inverted heat maps of the ratio. (I) Mean FmemRed/FmemGreen along the anterior-posterior axis of n e 10 primordia with 0 µm representing the front of each primordium. Red circles indicate the mean FmemRed/FmemGreen in embryos of the indicated genotype; black circles, where present, indicate the mean FmemRed/FmemGreen of wild-type embryos or heat-shocked control embryos. Gray bars indicate SEM. Anterior is to the left in (H). Scale bar, 20 μm. |
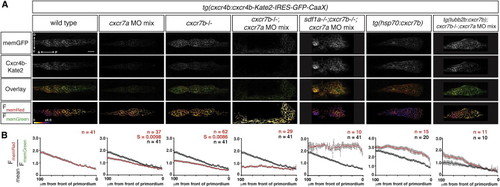
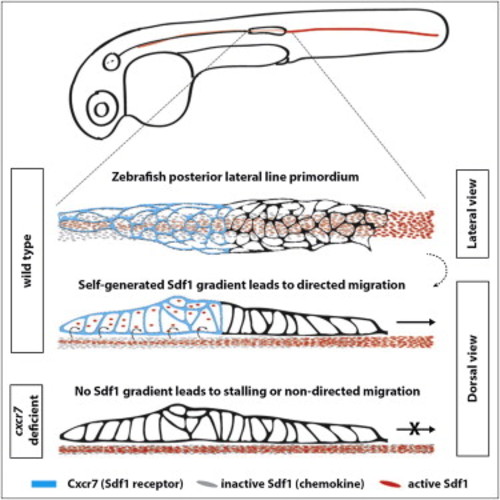
Cxcr7 Generates the Sdf1-Signaling Gradient across the Primordium (A) Single confocal slices through the primordium in live 36 hpf embryos of the indicated genotypes, all carrying the Sdf1-signaling sensor. The FmemRed/FmemGreen images are inverted heat maps of the ratio. (B) Mean FmemRed/FmemGreen along the anterior-posterior axis of n e 10 primordia with 0 μm representing the front of each primordium. Red circles indicate the mean FmemRed/FmemGreen in embryos of the indicated genotype; black circles, where present, indicate the mean FmemRed/FmemGreen of wild-type embryos, heat-shocked control embryos, or cxcr7-deficient control embryos. Gray bars indicate SEM. Anterior is to the left, and dorsal is up in (A). Scale bar, 20 μm. Note that cxcr7-deficient; tg(tubb2b:cxcr7b) embryos were injected with a low dose of cxcr7a MO mix. EXPRESSION / LABELING:
|
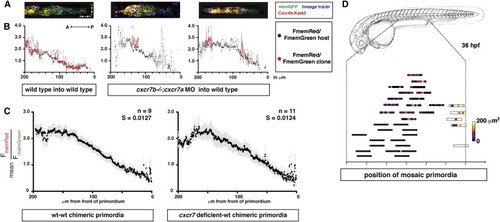
Cxcr7 Modifies the Sdf1-Signaling Gradient across the Primordium at the Tissue Level (A) Single confocal slices through mosaic primordia in live 36 hpf embryos of the indicated genotypes. (B) Quantification of mean FmemRed/FmemGreen of host cells (black dots, gray bars SEM) and donor cells (red dots, light-red bars SEM) across the anterior-posterior axis of primordia shown in (A). (C) FmemRed/FmemGreen ratio on the host cells only across wild-type-wild-type and cxcr7 deficient-wild-type chimeric primordia containing the Sdf1-signaling sensor. The front of the primordium is at 0 μm. Gray bars indicate SEM. (D) Position of mosaic primordia compared to cxcr7b mutant (black rectangles) and wild-type primordia (white rectangle). The amount (heat map in μm3) and position of clonal tissue across 150 μm from the front of the schematized primordia is indicated. |
|
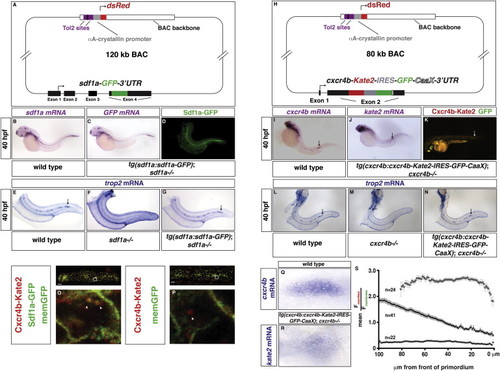
Characterization of the Transgenic Fish Lines tg(sdf1a:sdf1a-GFP) and tg(cxcr4b:cxcr4b-Kate2-IRES-GFP-CaaX), Related to Figures 2, 3, and 4 (A) Schematic overview of the sdf1a:sdf1a-GFP transgene. (B) 40 hpf wild-type embryo stained for sdf1a mRNA. (C, D) 40 hpf tg(sdf1a:sdf1a-GFP)p10; sdf1a/ embryos stained for GFP mRNA (C) or Sdf1a-GFP protein (D). (E–G) trop2 mRNA staining labeling the primordium and deposited neuromasts in 40 hpf wild-type (E), sdf1a/ (F) and tg(sdf1a:sdf1a-GFP)p10; sdf1a/ embryos (G). (H) Schematic overview of the cxcr4b:cxcr4b-Kate2-IRES-eGFP-CaaX transgene. (I–K) (I) 40 hpf wild-type embryo stained for cxcr4b mRNA. (J, K) 40 hpf tg(cxcr4b:cxcr4b-Kate2-IRES-GFP-CaaX)p7; cxcr4b/ embryos stained for kate2 mRNA (J) or imaged live for Kate2 and GFP fluorescence (K). Arrows in J to K indicate the primordium. (L–N) trop2 mRNA staining labeling the primordium and deposited neuromasts in 40 hpf wild-type (L), cxcr4b/ (M) and tg(cxcr4b:cxcr4b-Kate2-IRES-GFP-CaaX)p7; cxcr4b/ embryos (N). Arrows in (E–G) and (L–N) indicate the extent of primordium migration. (O and P) Primordium from a 28 hpf tg(sdf1a:sdf1a-GFP)p10; tg(cxcr4b:cxcr4b-Kate2-IRES-GFP-CaaX); cxcr7b/ embryo (O) and primordium from a 28 hpf tg(cxcr4b:cxcr4b-Kate2-IRES-GFP-CaaX); cxcr7b/ embryo (P) stained for Kate2 (red) and GFP (green). (O) and (P) represent cells bounded by the white box in the overview image of the primordium. Arrowheads indicate the colocalization of Sdf1a-GFP and Cxcr4b-Kate2 puncta in O and Cxcr4b-Kate2 in P. (Q–R) High resolution images of the primordium in a 40 hpf wild-type embryo stained for cxcr4b mRNA (Q) and 40 hpf tg(cxcr4b:cxcr4b-Kate2-IRES-GFP-CaaX)p7; cxcr4b/ embryo stained for kate2 mRNA (R). (S) Mean FmemRed/FmemGreen ratio values across primordia from wild-type (solid circles), sdf1a/ (triangles) and tg(hsp70:sdf1a) embryos (open circles). The front of the primordium is at 0 μm. The gray bars indicate SEM. |
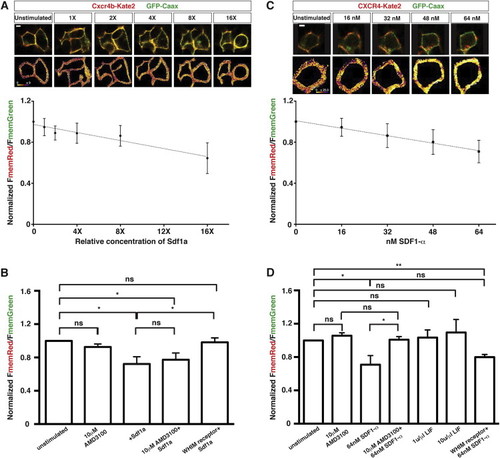
Human and Zebrafish Versions of the Sdf1-Signaling Sensor Respond Linearly and Specifically to Increasing Extracellular Concentrations of Sdf1 Protein In Vitro, Related to Figure 3 (A) Response of fish Sdf1-signaling sensor expressed in HEK293T cells to increasing relative concentrations of purified, recombinant zebrafish Sdf1a (n = 5). The line represents the linear regression of relative concentrations of Sdf1a versus normalized FmemRed/FmemGreen. The R2 of the regression is 0.9313. FmemRed/FmemGreen ratios are normalized to the membrane ratios of unstimulated cells. Representative composite images of Cxcr4b-Kate2 and GFP at each Sdf1a concentration are shown above the graph. (B) Response of the Sdf1-signaling sensor to extracellular Sdf1a after blocking receptor internalization with AMD3100 or the WHIM mutation (n = 5). Note that AMD3100 does not appear to antagonize the fish Cxcr4b receptor. FmemRed/FmemGreen ratios are normalized to the membrane ratios of unstimulated cells expressing the same version of the signaling sensor. The same amount of Sdf1a was added for all conditions marked with +Sdf1a. (C) Response of human SDF1-signaling sensor expressed in HEK293T cells to increasing concentrations of recombinant human SDF1α. The line represents the linear regression of relative concentrations of SDF1α versus normalized FmemRed/FmemGreen. The R2 of the regression is 0.9312. Representative composite images of CXCR4-Kate2 and GFP at each SDF1α concentration are shown above the graph. (D) Response of the Sdf1-signaling sensor to extracellular SDF1α after blocking receptor internalization with AMD3100 or the WHIM mutation and upon stimulation with an unrelated recombinant cytokine, LIF. FmemRed/FmemGreen ratios are normalized to the membrane ratios of unstimulated cells expressing the same version of the signaling sensor. Error bars in (A–D) represent SEM. Scale bar represents 5 μιχρονσ. = p < 0.05, = p < 0.01, ns = p > 0.05 (not statistically significant). |
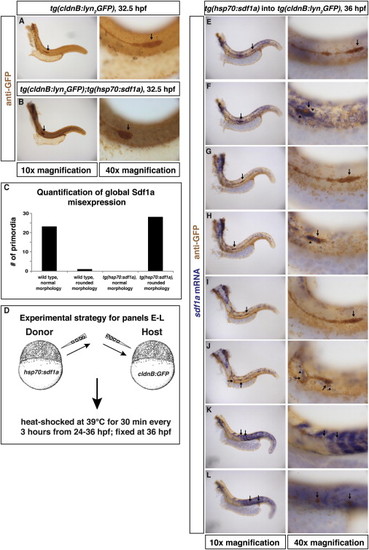
Ectopic Sources of Sdf1a Attract the Primordium, Related to Figure 3 (A) Heat-shocked tg(cldnB:lyn2GFP) embryo stained for GFP protein (brown) to visualize the primordium (arrow). (B) Similarly treated tg(cldnB:lyn2GFP); tg(hsp70:sdf1a) embryo. (C) Quantification of primordia morphology in heat-shocked wild-type and tg(hsp70:sdf1a) embryos. (D) Experimental strategy for local mis-expression of Sdf1a during primordium migration. (E–L) 36 hpf chimeric embryos comprised of tg(hsp70:sdf1a) donor cells and tg(cldnB:lyn2GFP) host cells. Embryos were stained for GFP protein to visualize the primordium (arrow) and sdf1a mRNA to identify donor cells that overexpress sdf1a. (E and F) Sdf1a mis-expression in some of the front and rear cells of the primordium (arrowheads in F) disrupts its migration (arrow in F) compared to the primordium on the contralateral control side of the same embryo (arrow in E). (G and H) Sdf1a mis-expression in the rear cells of the primordium (arrowhead in H) stalls primordium migration (arrow in H) compared to the contralateral control side of the same embryo (arrow in G). (I and J) Sdf1a mis-expression along the migratory route (arrowheads in J) redirects the primordium to the ectopic Sdf1a source (arrows in J) compared to the contralateral control side of the same embryo (I). (K and L) Sdf1a mis-expression in the somites results in a fragmented primordium (arrows in K and L) on both sides of the embryo. |
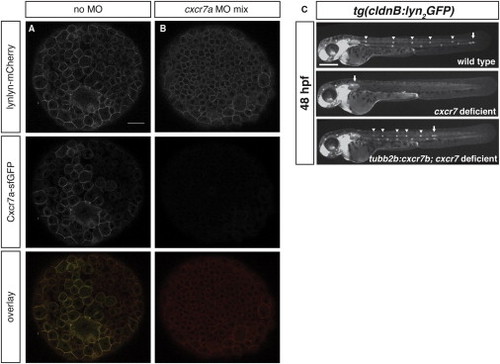
Characterization of cxcr7a Morpholino Mix and Rescue of Primordium Migration in cxcr7-Deficient Embryos Expressing cxcr7b in the Posterior Lateral Line Nerve, Related to Figures 1 and 4 (A and B) Confocal sections through embryos injected with an mRNA mix coding for cxcr7a-sfGFP and lyn2-mCherry without (A) or with translation blocking cxcr7a morpholinos A and B (B). Scale bar, 30 μm. (C) Position of primordia in representative embryos of the indicated genotypes. Scale bar 300 μm. |
Reprinted from Cell, 155(3), Venkiteswaran, G., Lewellis, S.W., Wang, J., Reynolds, E., Nicholson, C., and Knaut, H., Generation and Dynamics of an Endogenous, Self-Generated Signaling Gradient across a Migrating Tissue, 674-687, Copyright (2013) with permission from Elsevier. Full text @ Cell