
|
Fig. S3
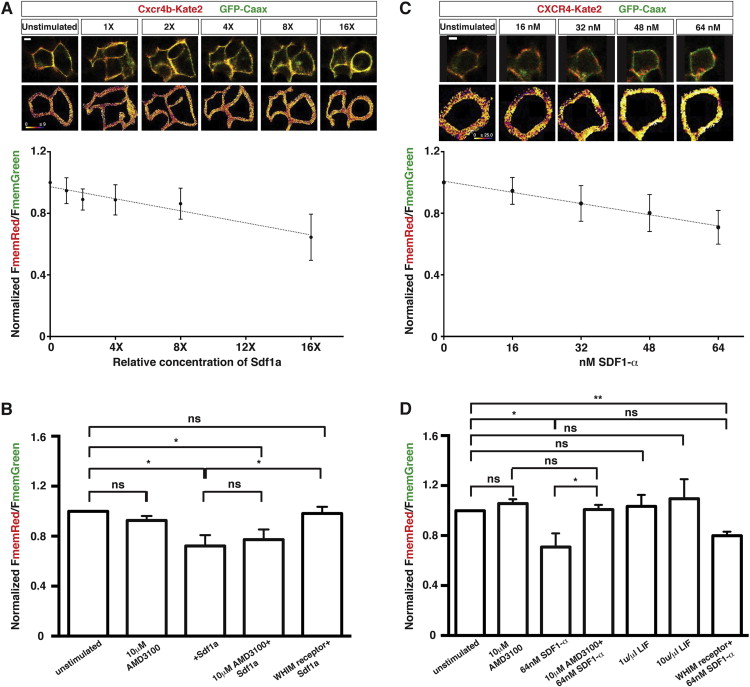
Human and Zebrafish Versions of the Sdf1-Signaling Sensor Respond Linearly and Specifically to Increasing Extracellular Concentrations of Sdf1 Protein In Vitro, Related to Figure 3
(A) Response of fish Sdf1-signaling sensor expressed in HEK293T cells to increasing relative concentrations of purified, recombinant zebrafish Sdf1a (n = 5). The line represents the linear regression of relative concentrations of Sdf1a versus normalized FmemRed/FmemGreen. The R2 of the regression is 0.9313. FmemRed/FmemGreen ratios are normalized to the membrane ratios of unstimulated cells. Representative composite images of Cxcr4b-Kate2 and GFP at each Sdf1a concentration are shown above the graph.
(B) Response of the Sdf1-signaling sensor to extracellular Sdf1a after blocking receptor internalization with AMD3100 or the WHIM mutation (n = 5). Note that AMD3100 does not appear to antagonize the fish Cxcr4b receptor. FmemRed/FmemGreen ratios are normalized to the membrane ratios of unstimulated cells expressing the same version of the signaling sensor. The same amount of Sdf1a was added for all conditions marked with +Sdf1a.
(C) Response of human SDF1-signaling sensor expressed in HEK293T cells to increasing concentrations of recombinant human SDF1α. The line represents the linear regression of relative concentrations of SDF1α versus normalized FmemRed/FmemGreen. The R2 of the regression is 0.9312. Representative composite images of CXCR4-Kate2 and GFP at each SDF1α concentration are shown above the graph.
(D) Response of the Sdf1-signaling sensor to extracellular SDF1α after blocking receptor internalization with AMD3100 or the WHIM mutation and upon stimulation with an unrelated recombinant cytokine, LIF. FmemRed/FmemGreen ratios are normalized to the membrane ratios of unstimulated cells expressing the same version of the signaling sensor. Error bars in (A–D) represent SEM. Scale bar represents 5 μιχρονσ. = p < 0.05, = p < 0.01, ns = p > 0.05 (not statistically significant).
Reprinted from Cell, 155(3), Venkiteswaran, G., Lewellis, S.W., Wang, J., Reynolds, E., Nicholson, C., and Knaut, H., Generation and Dynamics of an Endogenous, Self-Generated Signaling Gradient across a Migrating Tissue, 674-687, Copyright (2013) with permission from Elsevier. Full text @ Cell