
- Title
-
In Vivo analysis reveals a highly stereotypic morphogenetic pathway of vascular anastomosis
- Authors
- Lenard, A., Ellertsdottir, E., Herwig, L., Krudewig, A., Sauteur, L., Belting, H.G., and Affolter, M.
- Source
- Full text @ Dev. Cell
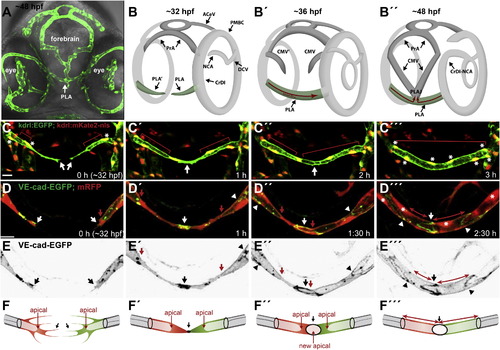
Palatocerebral Artery Forms through Fusion of Two Lumenized Angiogenic Sprouts (A) Front view of a zebrafish Tg(kdrl:EGFP)s843 embryo head at <48 hpf. Blood vessels (green) together with bright-field image show the location of PLA within the head tissue (arrow). (B) Schematic representation of PLA development (green) in the head vasculature from 32 to 48 hpf. PLA, palatocerebral artery; PLAJ, junction of the palatocerebral arteries; CrDI, cranial division of the internal carotid artery; DCV, dorsal ciliary vein; PrA, prosencephalic artery; PMBC, primordial midbrain channel; ACeV, anterior (rostral) cerebral vein; CMV, communicating vessel; NCA, nasal ciliary artery. (C) Still pictures of a time-lapse movie showing formation of the PLA in a transgenic embryo Tg(kdrl:EGFP)s843;(kdrl:mKate-nls)ubs13. Endothelial cell cytoplasm is green and the nuclei are yellow (*). The PLA sprouts (C, arrows) extend from the CrDI and grow toward each other. Red bars mark the lumen length. The sprouts contact each other and anastomose (white arrow) to form a lumenized vessel that consists of five to six cells. (D) Still pictures of a time-lapse movie showing the formation of the PLA in a transgenic embryo Tg(fliep:GFF)ubs3,(UAS:mRFP),(UAS:VE-cadherinΔC-EGFP)ubs12. Cell-cell junctions are shown in green and cell cytoplasm in red. PLA sprouts (D, white arrows) are led by single tip cells connected to the stalk by a ring-shaped junction (D2-D32, white arrowheads). Red arrows show the lumen margin in each sprout. Upon contact of the sprouts, a spot of VE-cadherin-EGFP appears (D2, white arrow). The spot elongates into a ring-shaped junction (D3, D32, white arrow), and lumen is pushed through the junction for vessel perfusion (D3 and D32 red arrows). An asterisk marks the endothelial nuclei. (E) VE-cadherin-EGFP only (black), corresponding to stills in (D). (F) A cellular model of PLA fusion. Time points correspond to the images shown above. Red and green cells are tip cells; stalk cells are gray. Black arrows show the sprouts (F) and the contact formation (F2-F32). Red arrows show the luminal/apical membrane (F-F3) or transcellular lumen (F32). See also Figure S1 and Movie S1. Scale bars, 20 μm. |
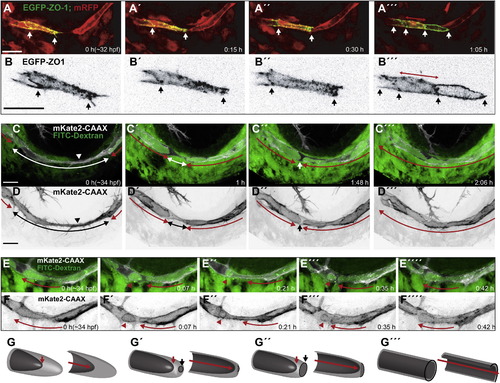
Lumen Formation in the PLA (A and B) Still pictures of a time-lapse movie showing contact and lumen formation in a transgenic embryo Tg(fliep:GFF)ubs3,(UAS:mRFP),(UAS:EGFP-ZO-1)ubs5. One of the tip cells is labeled with EGFP-ZO-1 (green). ECs cytoplasm is red. White arrows point the ends of the labeled cell (A–A3) and the edges of EGFP-ZO-1 rings (A32) when the cell becomes a unicellular tube with transcellular lumen (A32, red arrow). (B) shows the EGFP-ZO-1 labeled cell alone, enlarged 2× (black). (C and D) Still pictures of a time-lapse movie showing lumen formation in the PLA in a transgenic embryo TgBAC(kdrl:mKate-CAAX)ubs16 injected with FITC-dextran. After the tip cell contact is established, the luminal/apical membrane (red arrows) invaginates toward the contact site (C, D, arrowheads). White/black arrows shows the nonlumenized cell parts. Dextran (green) reaches the end of the luminal membrane, showing that the lumen is connected to the circulation. The membrane invagination advances from both sides (red arrows) until the two lumens are only separated by a small part of the cell body (C3/D3 white/black arrows). Perfusion of the lumen involves membrane fusion and connects the two lumens allowing the dextran to flow through. (E and F) Still pictures of a time-lapse movie showing possible apical membrane rearrangements after initial lumen perfusion. A fully formed lumen (red arrow marks continuous lumen) partially collapses leading to separation of an apical membrane compartment in the form of a large sphere filled with Dextran (red arrowheads). The sphere can be maintained for a certain time (E3 and E32), and finally it reconnects with the neighboring luminal compartment. (G) A 3D model of a tip cell undergoing transcellular lumen formation through cell membrane invagination. The basal membrane is light gray; the apical/luminal membrane is dark gray. Red arrows point out the lumen end and the lumen length (in the cross section models). Black arrows show the new contact formation site, with junctions marked in black and new apical membrane in dark gray within. Scale bars, 20 μm. See also Figures S1 and S2 and Movies S2 and S3. |
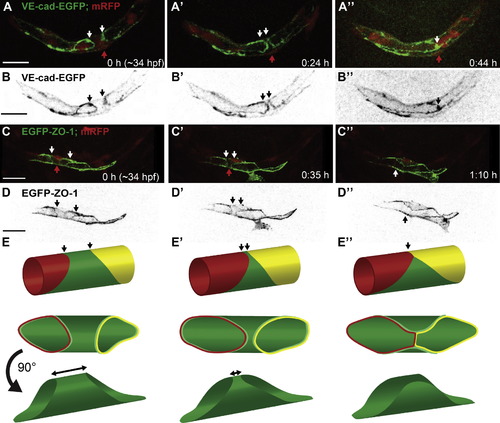
Formation of a Multicellular Tube through Cell Rearrangements (A and B) Still pictures of a time-lapse movie showing PLA formation in a transgenic embryo Tg(fliep:GFF)ubs3,(UAS:mRFP),(UAS:VE-cadherinΔC-EGFP)ubs12. Cell-cell junctions are marked in green and cell cytoplasm in red. One of the cells is a unicellular tube (A, red arrow) connected to the neighboring cells by ring shaped junctions (A and B, white/black arrows). A blood cell is visible within the lumen. With time the junctional rings move closer together meaning the neighboring cells migrate toward each other (A2, white arrows). Finally the rings meet making a new connection visible as a line of junctions (A3, white arrow). At this time point several blood cells go through the vessel. (B) shows VE-cadherin-EGFP alone (black). (C and D) Still pictures of a time-lapse movie showing cell rearrangements in a transgenic embryo Tg(fliep:GFF) ubs3,(UAS:mRFP),(UAS:EGFP-ZO-1)ubs5. The images show time points corresponding to (A), with only a single cell marked with EGFP-ZO-1 (C, green; D, black) and the endothelial cell cytoplasm in red. The cell (C, red arrow) is connected to the neighboring cells by ring shaped junctions. The cell body narrows on one side of the tube as the junctional rings move closer together (white arrows point the narrowing cell side). Finally, the cell splits on one side changing from unicellular tube into a flat cell, a part of the multicellular tube with one continuous junctional ring (white arrow). (E) A cellular model of unicellular to multicellular tube transformation. The middle cell (green) is initially a unicellular tube (E). The neighboring cells (red, yellow) move closer together making the green cell narrow on one side of the tube (E2). Finally the green cell splits on one side of the tube to allow the red and yellow cells to meet and establish a new connection (E3, arrow). Scale bars, 20 μm. See also Figure S2 and Movies S2 and S4. |
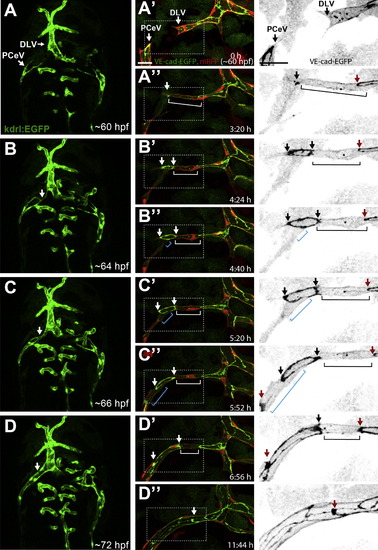
PCeV Forms through Cell Rearrangement and Cell-Splitting Events Still pictures of a time-lapse movie showing the formation of the PCeV (posterior (caudal) cerebral vein). (A)–(D) show a dorsal view (anterior up) of the head vasculature (green) at 60–72 hpf of a Tg(kdrl:EGFP)s843 zebrafish embryo. The fusing PCeV and DLV (dorsal longitudinal vein) are marked with white arrows. (A2)–(D3) show close-up of the PCeV fusion at time points corresponding to (A)–(D) of a transgenic embryo Tg(fliep:GFF)ubs3,(UAS:mRFP),(UAS:VE-cadherinΔC-EGFP)ubs12. Right panel shows a close-up of VE-cadherin-EGFP alone (black). Two lumenized sprouts approach each other led by single tip cells (A2, white arrows). A spot of VE-cadherin-EGFP is visible upon contact (A32, white arrow). The spot becomes a ring as the cell contact surface expands (B2 and B3, white/black arrows show ring edges). Transcellular lumen forms in both tip cells (B2–C3, white and blue bars). When the lumen is perfused, the new junctional ring approaches junctions of following cells and contacts them (C2 and D3, red arrows), indicating cell rearrangements that transform the vessel into a multicellular tube. Scale bars, 20 μm. See also Movie S5. |
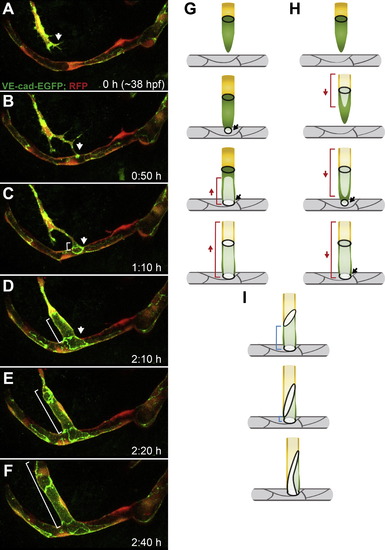
Fusion of a CMV Sprout to an Existing PLA Vessel (A–F) Still pictures of a time-lapse movie showing fusion of CMV to PLA in a transgenic embryo Tg(fliep:GFF)ubs3,(UAS:mRFP),(UAS:VE-cadherinΔC-EGFP)ubs12. CMV (communicating vessel) sprouts ventrally toward the PLA (A, arrow). The leading tip cell connects to the PLA on the cell body of one of the ECs making a spot of junctions (B, arrow). The newly formed ring connects to an existing junctional line on the PLA (C, arrow) and transcellular lumen forms in the CMV tip cell from the PLA upward (C, white bar). The lumen extends through the whole sprout (E and F, white bar). (G) A cellular model of the CMV-PLA fusion. The CMV tip cell is green, followed by a yellow stalk. The PLA is bright gray with dark gray junctions. CMV makes a new junctional connection to the PLA (black ring, arrow). Lumen (bright green, red bar) is pushed through the tip cell and inflates up the sprout. (H) A model of an alternative lumen formation process, where the CMV is lumenized from the CMV sprout toward the PLA (follow the red bars). (I) Blue bars mark the cellular/junctional rearrangements leading to transformation of the CMV into a multicellular tube. See also Movie S6. Scale bars, 20 μm. |
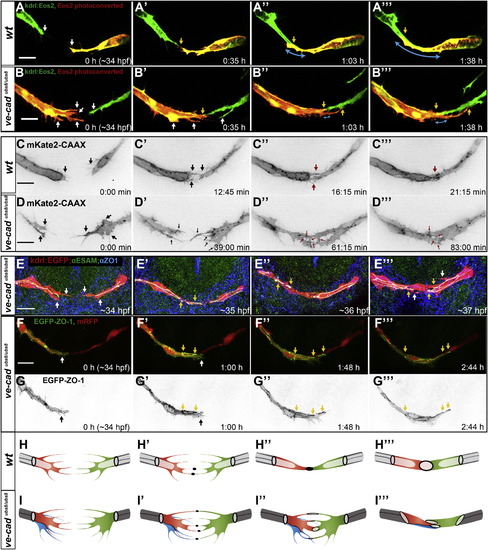
VE-Cadherinubs8/ubs8 Embryos Show Defects in the Initial Steps of the Fusion Process (A and B) Still pictures of a time-lapse movie showing development of the PLA in a transgenic line ve-cadubs8/ubs8;Tg(kdrl:tdEos2)ubs15; of a wild-type embryo (A) and a ve-cadherinubs8/ubs8 embryo (B). White arrows point at cell extensions, single on each sprout in the wild-type (WT) embryo (A) and multiple in ve-cadherinubs8/ubs8 mutant (B). Upon contact formation, the WT sprouts have one contact point (A2, yellow arrow) and do not form additional extensions, as the contact surface elaborates (A3 and A32, yellow arrows point at the sprout end, blue arrows show the length of the contact surface). The ve-cadherinubs8/ubs8 sprouts form multiple extensions (B2–B32, white arrows) and multiple contact points form between the sprouts (yellow arrows). The continuous contact surface of the sprouts expands slowly (blue arrows). (C and D) Still pictures of spinning disc time-lapse movies showing development of the PLA in transgenic line TgBAC(kdrl:mKate2-CAAX)ubs16 of wild-type (C) and VE-cadherin mutant (ve-cadubs8/ubs8) (D) embryos. Black arrows point at sprouting cell extensions, single or double in WT (C and C2) and multiple in ve-cadherinubs8/ubs8 vessels (D and D2). Red arrows point at cell-cell contacts. These contacts resolve into a continuous contact surface in wild-type (C3–C33), whereas in the mutant they persist over time resulting in a noncontinuous contact surface (D3 and D32). (E) Antibody staining of fusion steps corresponding to images in (A). Ve-cadubs8/ubs8;Tg(kdrl:EGFP)s843 embryos (red) and anti-ZO-1 (blue) and anti-ESAM (green) antibodies were used. Junctions within vessels are visible where signals overlap (white). White arrows mark cell extensions (E). Yellow arrows mark the contact points where junctional proteins are deposited (E2–E32). (F and G) Still pictures of a time-lapse movie showing contact formation in a transgenic embryo ve-cadherinubs8/ubs8;Tg(fliep:GFF)ubs3;(UAS:mRFP);(UAS:EGFP-ZO-1). EGFP-ZO-1 (green in F; black in G) is expressed in only one tip cell. Cell bodies are red (F). Upon contact of the tip cells a junctional ring forms (F2 and G2, yellow arrows), but the cell forms new extensions (white arrow) that form additional contacts with the other sprout (F3 and F32, yellow arrows). (H and I) Cellular models of initial steps of the fusion process in wild-type (H) and ve-cadherinubs8/ubs8 vessels (I). Initially, both sprouts form multiple extensions, which in the wild-type are limited to one to two per tip cell (H and H2) and in the mutant often reach three to five (I and I2). Multiple cells can be present at the leading tip of the mutant sprout (I, red and blue cell) increasing the number of the observed extensions. When the filopodia touch, a contact is established with deposition of new junctional material in the wild-type (H2, black dots) as well as the mutant sprouts (I2, black dots). In the mutant, more contact spots are present. As the contact formation proceeds, the wild-type sprouts merge all the contact sites into one to form a continuous contact surface (H3 and H32), whereas the mutant sprouts fail to merge all the contact sites resulting in multiple and disturbed junctional connections. See also Figure S3 and Movies S8, S9, and S10. Scale bars, 20 μm. |
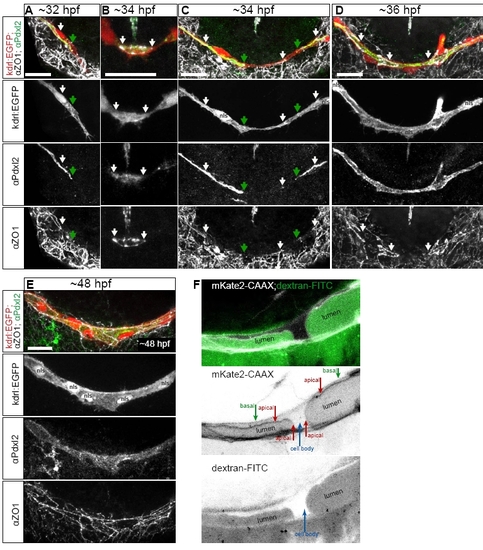
Podocalyxin-like 2 (Pdxl2) staining labels apical/luminal membrane during PLA fusion. Related to Fig. 1 and 2. A-E. Antibody staining for Pdxl2 (apical, green) and ZO-1 (junctional, white), in the PLA sprouts of Tg(kdrl:EGFP)s843 embryos (red). Pdxl2 labels the invaginating apical membrane (A, green arrows) extending beyond junctional contacts in the PLA sprout (A, white arrow). During fusion, apical membrane is present within the new junctional ring (B, arrows). Apical membrane (C, green arrows) extends inside the tip cells after new contact formation (C, middle white arrow). After transcellular lumen formation, continuous apical surface in the PLA marks perfused lumen; the staining is present within unicellular tubes, connected by junctional rings (D white arrows). Continuous apical surface is present during subsequent cell rearrangements leading to formation of a multicellular tube (E). Related to Fig. 1. F. Close view of the apical membrane invagination in a transgenic embryo TgBAC(kdrl:mKate2-CAAX)ubs16 (cell membranes in white) with dextran-FITC angiography (green). Basal and apical membrane compartments, cell body and lumen are marked in the single channel image. Related to Fig. 2. |
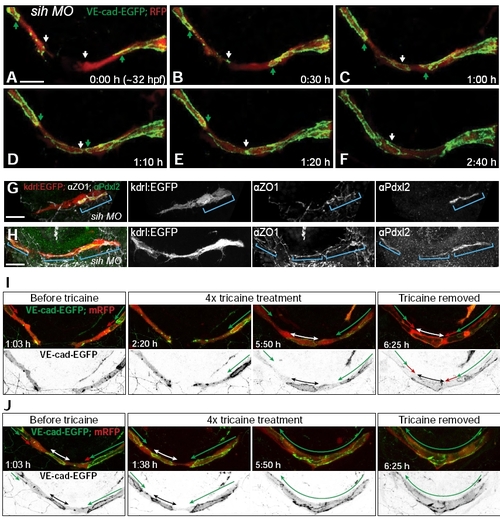
Transcellular lumen formation is highly influenced by blood flow. Related to Figure 1 and 3. A-F Still pictures of a time lapse movie showing development of the PLA in a transgenic embryo Tg(fliep:GFF)ubs3,(UAS:mRFP),(UAS:VE-cadherinΔC-EGFP)ubs12 injected with tnnt2 morpholino (sih) blocking the heart beat and hence, blood flow. The formation of PLA sprouts in the sih embryos is normal. As in the wild type, they are led by single tip cells (A, white arrows) attached to the stalk by ring shaped junctions (A, green arrows). All the steps of new contact formation are conserved, including new spot formation (B, white arrow), ring formation (C, white arrow) and cellular rearrangements (D-F, white and green arrows point at borders of junctional rings and new contact formation spots). Movie upon request. G-H Pdxl2 (apical, green) and ZO-1 (junctional, white) staining of PLA at particular fusion steps in silent heart embryos. Blue bars mark the surface of cell-cell junctional contacts. Pdxl2 staining is only visible within the junctional rings and lines, since no membrane invagination takes place. I-JStill pictures of a time lapse movie (Movie S7, I – embryo 1; J – embryo 2) showing development of the PLA in transgenic embryos Tg(fliep:GFF)ubs3,(UAS:mRFP),(UAS:VEcadherinΔC-EGFP)ubs12 before, during and after acute heart arrest with 4x tricaine. White/black arrows show the new contact length between PLA sprouts. Green arrows show multicellular parts of the sprouts (where continuous cell-cell junctions are visible). Red arrows show luminal membrane invagination/unicellular tube parts. After the heart arrest, lumen collapses and the fusion process continues like it the silent heart embryos. In the younger embryo (I) fusion proceeds up to the VE-cadherin-GFP ring formation. In the slightly older embryo (J) – up to the end of cell rearrangements. When tricaine is removed, lumen inflates again and the fusion continues with unicellular tube formation in the younger embryo (I). In J, lumen is immediately inflated in the already formed multicellular cord. See also Movie S7. Scale bars: 20 μm. |
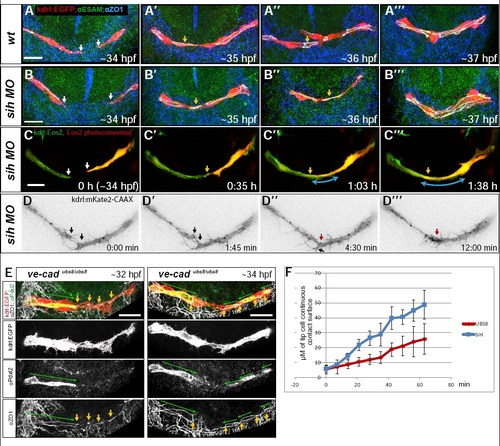
Junctional staining and live imaging of PLA fusion in silent heart and wild type embryos. Apical staining in VE-cadherinubs8/ubs8 embryos. Related to Fig. 7. A-B. Antibody staining for ZO-1 (blue) and ESAM (green) in transgenic Tg(kdrl:EGFP)s843 (red) embryos at stages corresponding to the time lapses in figure 7. The junctions within the vessels visible in white (ZO-1 and ESAM overlap) show the cellular architecture of the fusing sprouts in WT (A) and silent heart (B) embryos. White arrows point at cell extensions, yellow arrows at contact points. Single cells are present at the leading edge of the sprouts embryos (A, B) as well as single connection points are visible at later stages (A′-A′′′, B′-B′′′). C. Still pictures of a time lapse movie showing development of the PLA in a transgenic Tg(kdrl:tdEos2)ubs15 silent heart embryo. One of the tip cells was converted to red, the other one is green (C, white arrows). Yellow arrows show the contact point of the sprouts (C′-C′′′). Blue arrow shows the length of the connection. D. Still pictures of a spinning disc time lapse movie showing development of the PLA in a transgenic embryo TgBAC(kdrl:mKate2-CAAX)ubs16 silent heart embryo, at time points corresponding to Fig. 7 C-D. Black arrows point at filopodia, red arrows show the contact formation. E. Antibody staining labeling Pdxl2 (green) and ZO-1 (white) in the PLA of vecadherinubs8/ubs8;Tg(kdrl:EGFP)s843 embryos (red). Green arrows mark Pdxl2 staining localized to the apical membrane compartments defined by the junctions. Yellow arrows mark irregular cell-cell contacts at the fusion site. F. The graph shows the length of the tip cell contact surface of fusing PLA sprouts in vecadubs8/ubs8 (red) and silent heart (blue) control embryos, analyzed in photoconversion experiments over time (presented in Fig. 7B and S3C). The contact length was measured in μM every 7 minutes, starting with the first visible contact. The contact surface expansion in the mutant embryos is slower than in the sih due to the disturbed contact formation process. Data represent the mean for 7 movies (ubs8) and 4 movies (sih) +/- SD. See also Movie S8. Other movies upon request. Scale bars: 20 μm. |
Reprinted from Developmental Cell, 25(5), Lenard, A., Ellertsdottir, E., Herwig, L., Krudewig, A., Sauteur, L., Belting, H.G., and Affolter, M., In Vivo analysis reveals a highly stereotypic morphogenetic pathway of vascular anastomosis, 492-506, Copyright (2013) with permission from Elsevier. Full text @ Dev. Cell