
|
Fig. S3
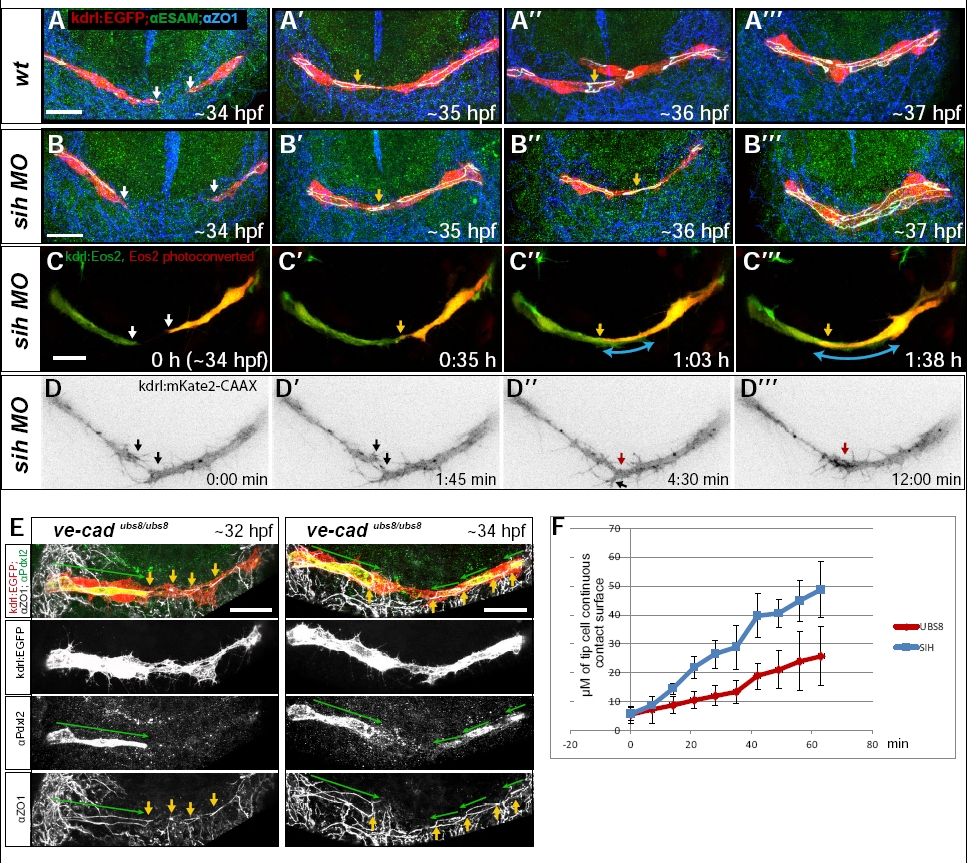
Junctional staining and live imaging of PLA fusion in silent heart and wild type embryos. Apical staining in VE-cadherinubs8/ubs8 embryos. Related to Fig. 7.
A-B. Antibody staining for ZO-1 (blue) and ESAM (green) in transgenic Tg(kdrl:EGFP)s843 (red) embryos at stages corresponding to the time lapses in figure 7. The junctions within the vessels visible in white (ZO-1 and ESAM overlap) show the cellular architecture of the fusing sprouts in WT (A) and silent heart (B) embryos. White arrows point at cell extensions, yellow arrows at contact points. Single cells are present at the leading edge of the sprouts embryos (A, B) as well as single connection points are visible at later stages (A′-A′′′, B′-B′′′).
C. Still pictures of a time lapse movie showing development of the PLA in a transgenic Tg(kdrl:tdEos2)ubs15 silent heart embryo. One of the tip cells was converted to red, the other one is green (C, white arrows). Yellow arrows show the contact point of the sprouts (C′-C′′′). Blue arrow shows the length of the connection.
D. Still pictures of a spinning disc time lapse movie showing development of the PLA in a transgenic embryo TgBAC(kdrl:mKate2-CAAX)ubs16 silent heart embryo, at time points corresponding to Fig. 7 C-D. Black arrows point at filopodia, red arrows show the contact formation.
E. Antibody staining labeling Pdxl2 (green) and ZO-1 (white) in the PLA of vecadherinubs8/ubs8;Tg(kdrl:EGFP)s843 embryos (red). Green arrows mark Pdxl2 staining localized to the apical membrane compartments defined by the junctions. Yellow arrows mark irregular cell-cell contacts at the fusion site.
F. The graph shows the length of the tip cell contact surface of fusing PLA sprouts in vecadubs8/ubs8 (red) and silent heart (blue) control embryos, analyzed in photoconversion experiments over time (presented in Fig. 7B and S3C). The contact length was measured in μM every 7 minutes, starting with the first visible contact. The contact surface expansion in the mutant embryos is slower than in the sih due to the disturbed contact formation process. Data represent the mean for 7 movies (ubs8) and 4 movies (sih) +/- SD. See also Movie S8.
Other movies upon request.
Scale bars: 20 μm.
Reprinted from Developmental Cell, 25(5), Lenard, A., Ellertsdottir, E., Herwig, L., Krudewig, A., Sauteur, L., Belting, H.G., and Affolter, M., In Vivo analysis reveals a highly stereotypic morphogenetic pathway of vascular anastomosis, 492-506, Copyright (2013) with permission from Elsevier. Full text @ Dev. Cell