
- Title
-
Premature aging in telomerase-deficient zebrafish
- Authors
- Anchelin, M., Alcaraz-Pérez, F., Martínez, C.M., Bernabé-García, M., Mulero, V., and Cayuela, M.L.
- Source
- Full text @ Dis. Model. Mech.
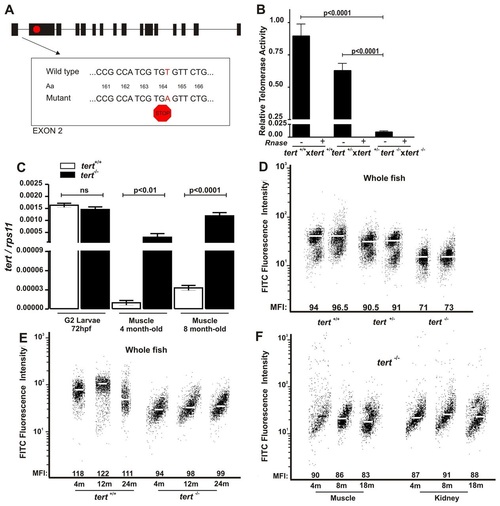
The dynamics of telomere and telomerase in tert mutant zebrafish. (A) Schematic representation of the telomerase gene mutation. (B) Telomerase activity was measured quantitatively in whole zebrafish embryos (3 dpf, n=100) by Q-TRAP using 0.1 mg of protein extract. Results are expressed as the mean value ± s.e.m. from triplicate samples relative to telomerase-positive cells. Statistical significance was assessed using Student’s t-test (P<0.05). To confirm the specificity of the assay, a negative control is included for each sample, treated with 1 µg of RNase at 37°C for 20 minutes. (C) The mRNA levels of tert gene were determined by real-time RT-PCR in larvae and adult muscle tissue of the indicated genotypes. Gene expression is normalized against rps11. Each bar represents the mean ± s.e.m. from 100 pooled animals for larvae and three individual fish for adult tissue and triplicate samples. (D) Representation of 3-month-old zebrafish cell distribution according to telomere length. Medium fluorescence intensity (MFI) is indicated for each genetic background. The same trend was observed in the three independent experiments. (E) Representation of wild-type and tert mutant zebrafish cell distribution throughout their life according to their telomere length. MFI is indicated for each genetic background. The same trend was observed in the three independent experiments. m, months. (F) Representation of zebrafish muscle and kidney cell distribution throughout life according to their telomere length. MFI is indicated for each genetic background. The same trend was observed in the three independent experiments. PHENOTYPE:
|
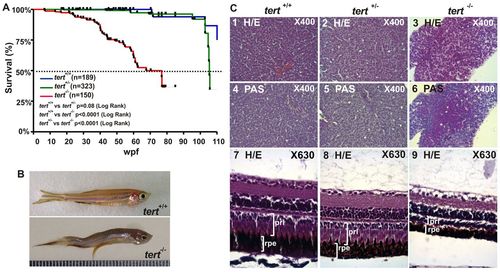
Premature aging signals in tert mutant zebrafish. (A) Kaplan-Meier representation of the survival of three genetic backgrounds. Post-hatching time is shown in weeks. A dashed line indicates 50% survival. The Log Rank test was used for statistical analysis. (B) Representative image of a tert+/+ and a tert-/- zebrafish at 11 months old. (C) Liver sections stained with H&E showed cytoplasmic vacuolization of hepatocytes (3) and were PAS-positive (6, white asterisks). H&E-stained eye sections revealed a decreased thickness of both retinal pigmented epithelium (rpe) and the photoreceptor layer (prl), which had a disorganized appearance (9, white arrowheads). Representative images are from at least three fish per genotype. PHENOTYPE:
|
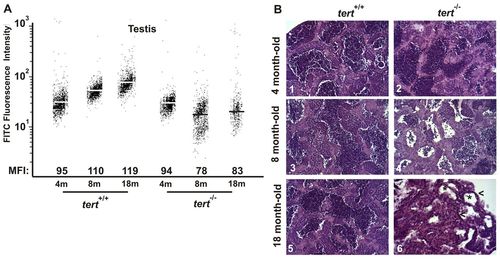
Premature alterations of the testis tissue of tert mutant zebrafish. (A) Representation of testis cell distribution from the wild-type and tert mutant genotype according to their telomere length. Medium fluorescence intensity (MFI) is indicated for each genetic background. The same trend was observed in the three independent experiments. (B) Representative image of zebrafish testis (n=3) from tert+/+ and tert-/- backgrounds at 4, 8 and 18 months old (200×). Asterisks in panel 6 indicate atrophic tubules, and arrowheads atrophic stroma. PHENOTYPE:
|
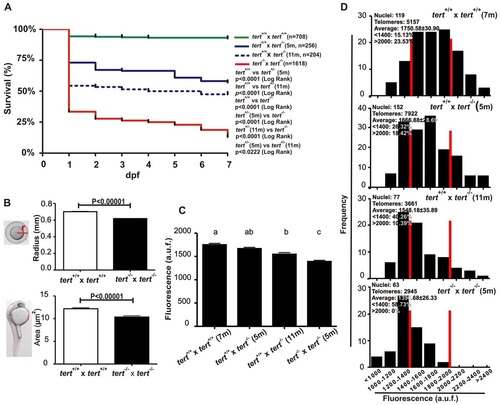
tert mutant zebrafish can be bred for only one generation. (A) Larval survival curve (Kaplan-Meier representation) of four different genetic backgrounds. n, number of zebrafish per genotype. Statistical significance was assessed using the Log Rank test. (B) tert mutant zebrafish eggs and their corresponding dechorionated embryos had a smaller size than their wild-type siblings at 24 hpf (ne50). Statistical significance according to Student’s t-test (P<0.00001). (C) Mean telomeric fluorescence values of 24-hpf embryos (ne100) from wild-type and mutant genetic backgrounds. Data are mean values ± s.e.m. and different letters (a, b, c) denote statistically significant differences among telomeric fluorescence values of each sample according to a Tukey test (P<0.05). (D) Histograms showing telomere fluorescence frequencies. The red lines demarcate the percentage of the shortest (<1400 a.u.f.) and the longest (>2000 a.u.f.) telomeres. a.u.f., arbitrary units of fluorescence. PHENOTYPE:
|
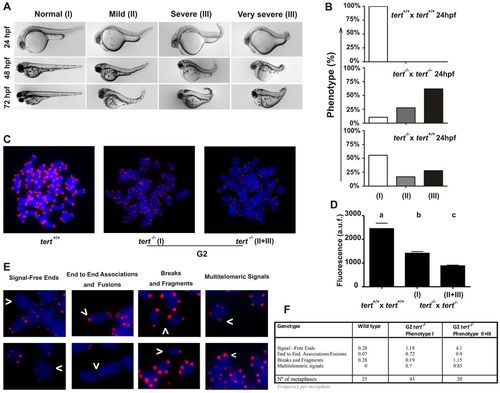
Telomere dysfunction and chromosomal aberrations in G2tert mutant zebrafish. (A) Representative image of the three groups of larvae resulting from tert-/- × tert-/- and tert+/+ × tert-/- parental matings. The phenotypes were scored as wild type (I), mildly affected (II) and severely affected (III), as indicated in the Materials and Methods. (B) Percentage of larval survival of the three groups observed in A at 1 dpf. (C) Metaphase chromosomes from tert+/+ and tert-/- cells were stained with DAPI, and the telomeres were visualized using FISH analysis. The phenotypes of mutant larvae were scored as indicated above. (D) Mean telomeric fluorescence values of 24-hpf embryos (ne100) from wild-type and mutant genetic backgrounds. Data are mean values ± s.e.m. Different letters (a, b, c) denote statistically significant differences among telomeric fluorescence values of each sample according to a Tukey test (P<0.05). (E) Examples of chromosomal aberrations. (F) Frequency of chromosomal aberrations in cell from 24-hour larvae. a.u.f., arbitrary units of fluorescence. PHENOTYPE:
|
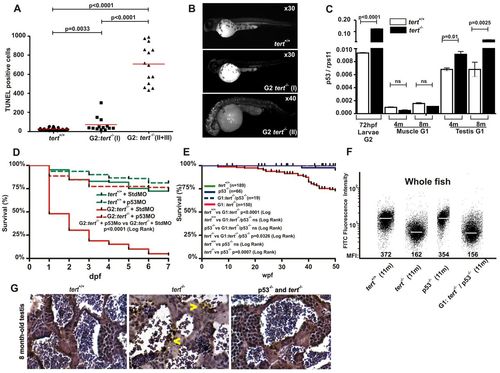
p53 is responsible for the induction of apoptosis, developmental malformations and mortality of G1 and G2tert mutant zebrafish. (A) Quantification of apoptotic cells based on TUNEL staining (see Materials and Methods). Significance was determined based on Student’s t-test (P<0.005). (B) Examples of embryos after TUNEL staining. (C) The mRNA levels of the p53 gene were determined by real-time RT-PCR in 72-hpf larvae, and muscle and testis tissues of adult zebrafish, in the indicated genotypes. Gene expression is normalized against rps11. Each bar represents the mean ± s.e.m. from 100 pooled animals for larvae and three individual fish for adult tissue and triplicate samples. (D) Survival of G2 tert-/- larvae microinjected at the one-cell stage with a morpholino against p53. (E) Kaplan-Meier representation of the survival of four genetic backgrounds. Post-hatching time is shown in weeks. The Log Rank test was used for statistical analysis. (F) Representation of total cell distribution from the four genotypes at the same age (11 months old) according to their telomere length. Medium fluorescence intensity (MFI) is indicated for each genetic background. The same trend was observed in the three independent experiments. (G) TUNEL assay in zebrafish testis sections from 8-month-old wild-type, tert mutant and double-mutant tert-/-; p53-/- zebrafish (400×). Arrowheads indicate apoptotic cells. |

Unillustrated author statements PHENOTYPE:
|